Political Networks of Companies - Graphics
(Old Data before inclusion of New Survey Participants)
Consolidated data
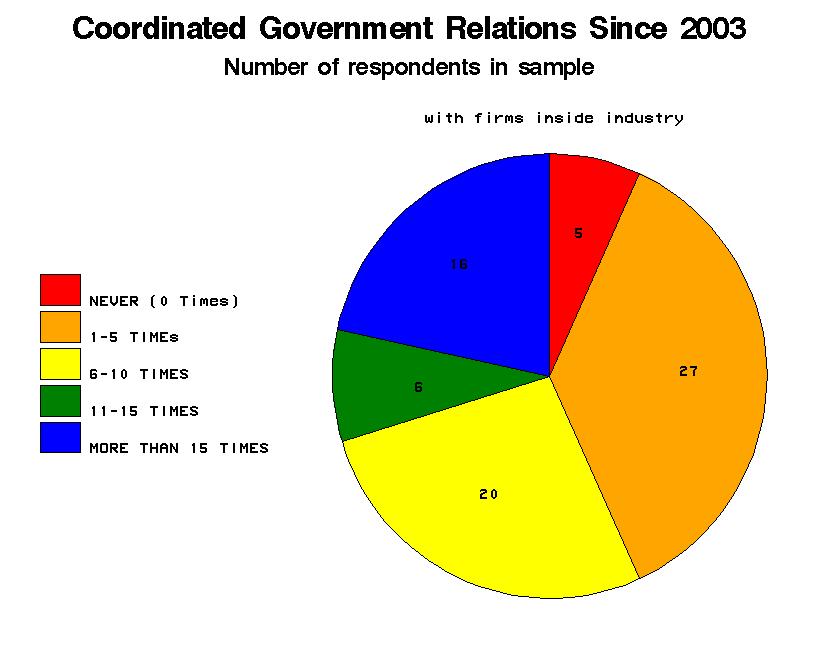
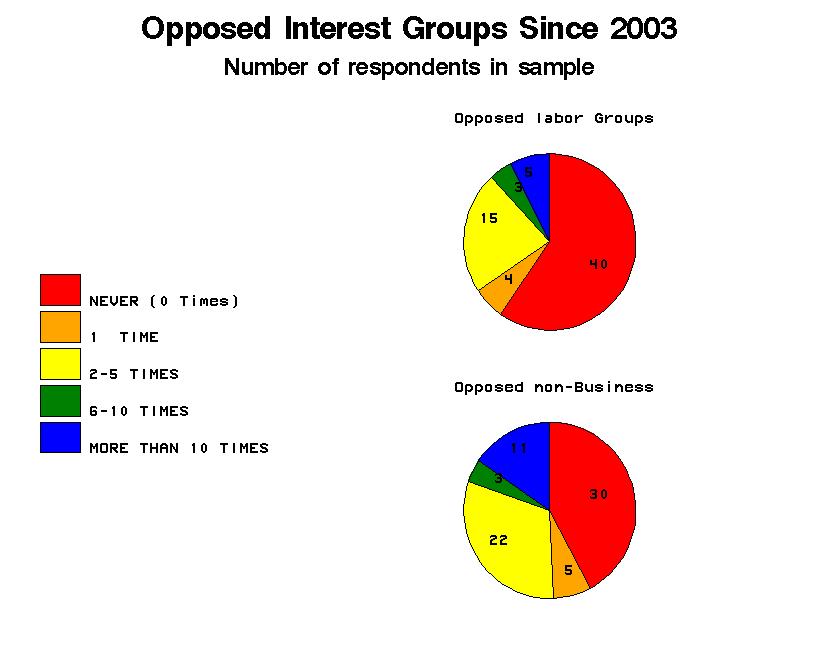
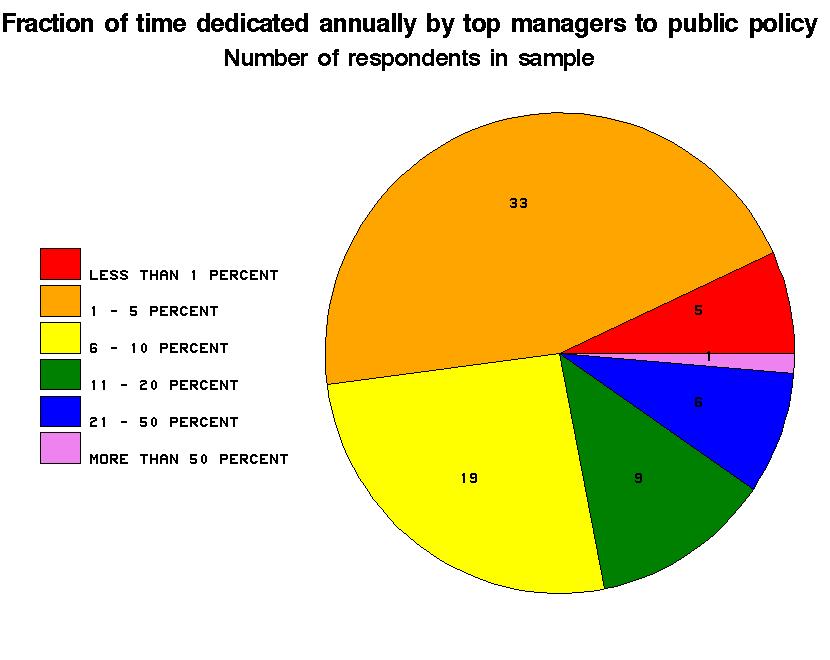
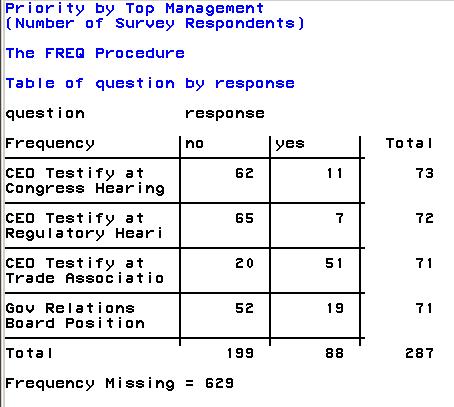
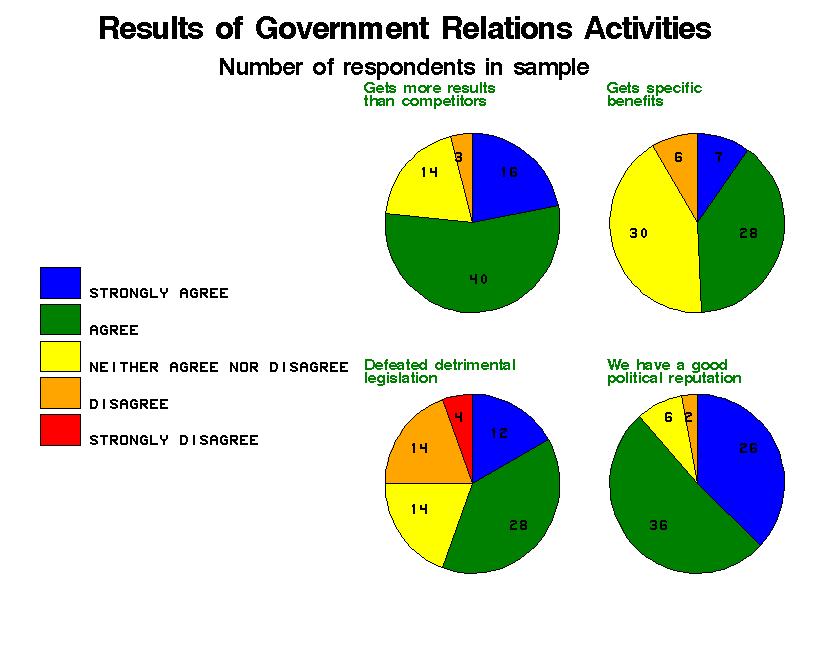
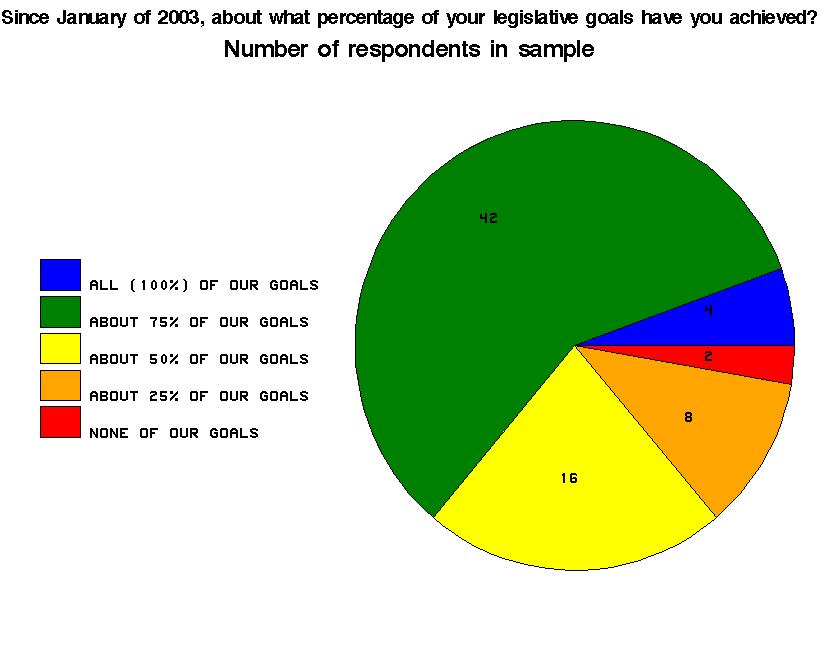
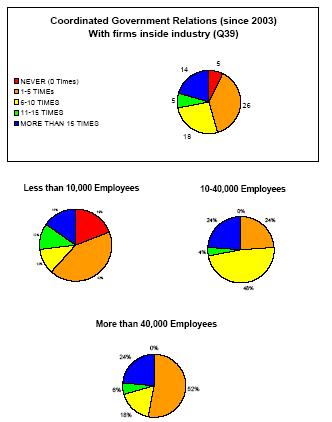
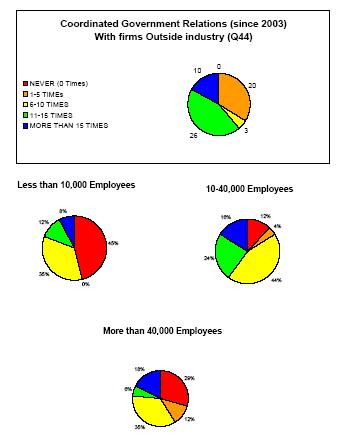
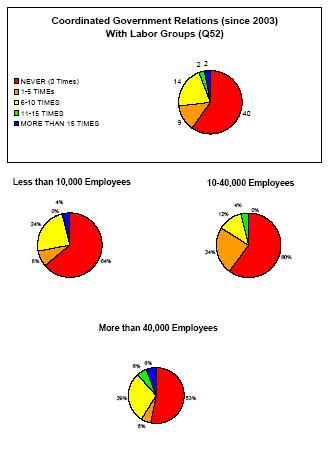
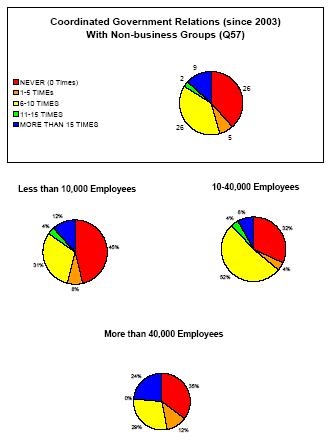
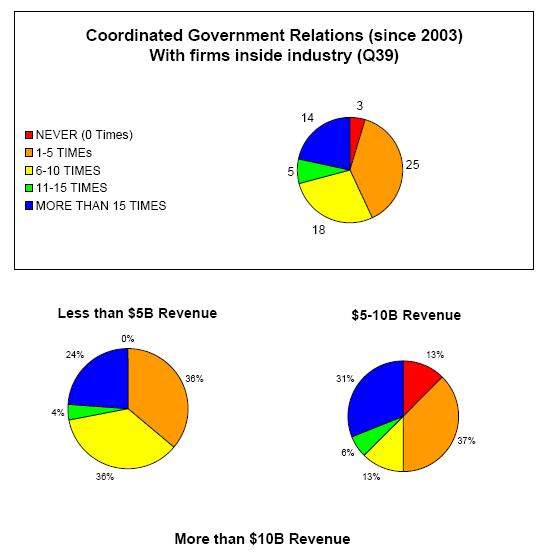
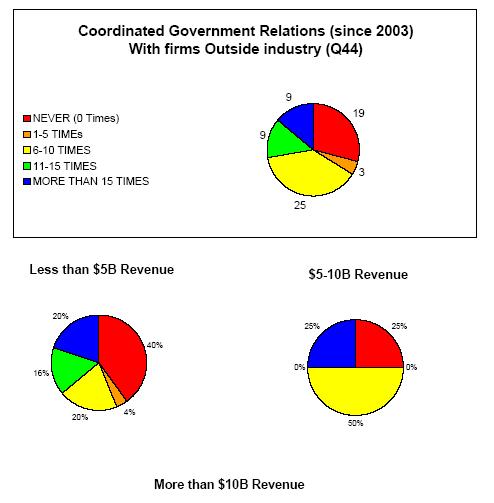
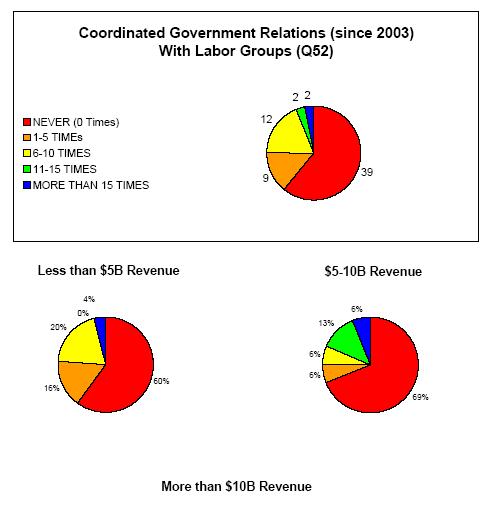
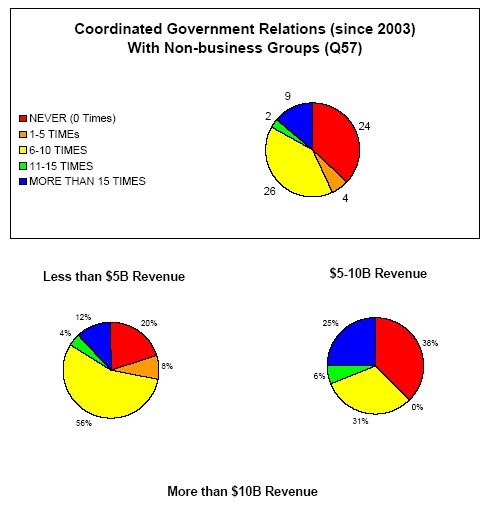
These are the SAS graphs (jpg) for all data (should be gif's, soor).
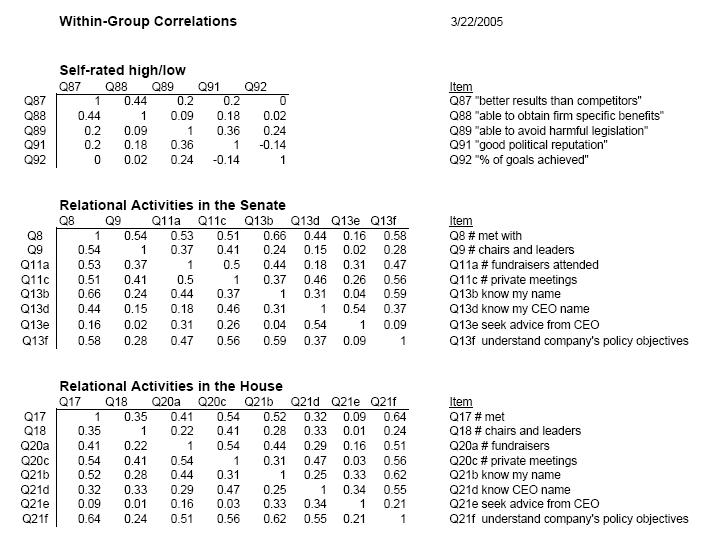
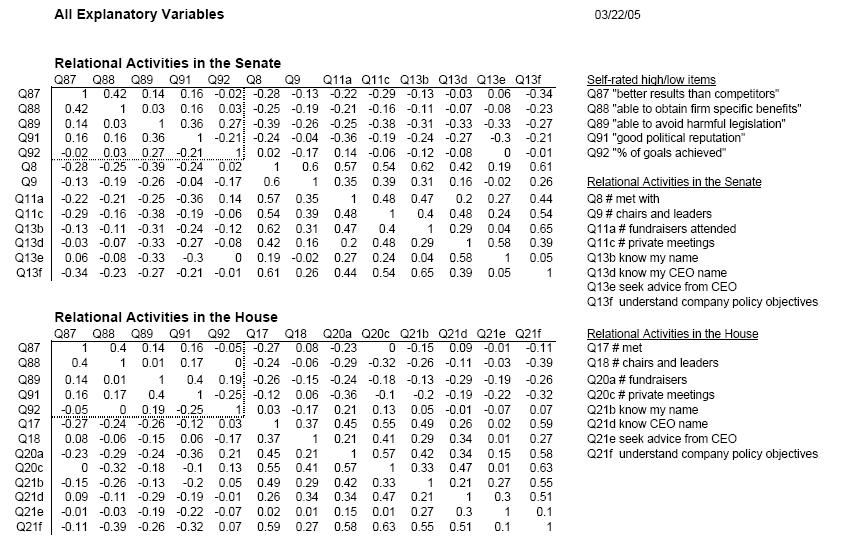
Correlations of Consolidated data ToP
Numerical correlations of Senate and House activities with the self-ranked high/low Predictors. These include the intimacy variables now, too. NOTE: Due to data entry inconstency, DO NOT USE previous versions of this data. Confidence intervals on these correlations need to be constructed.
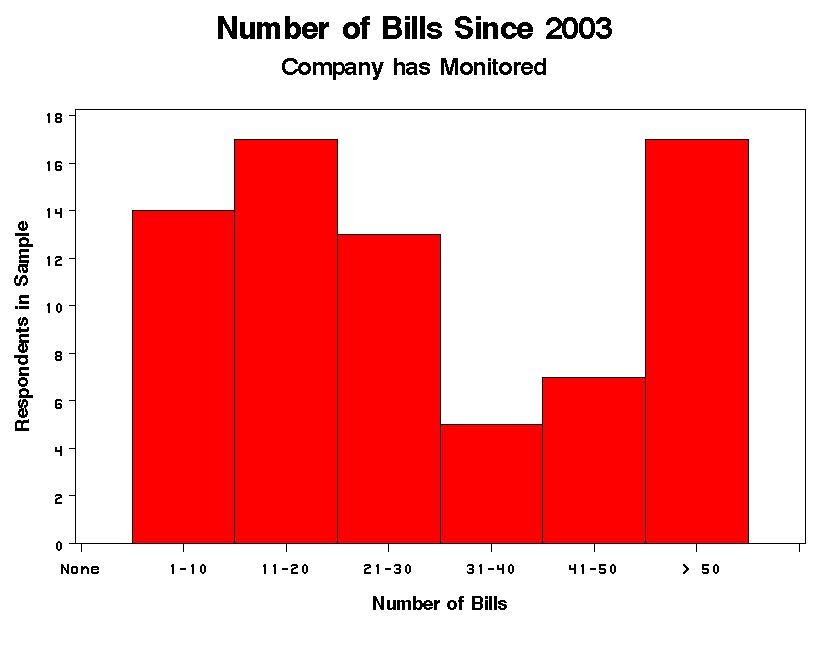
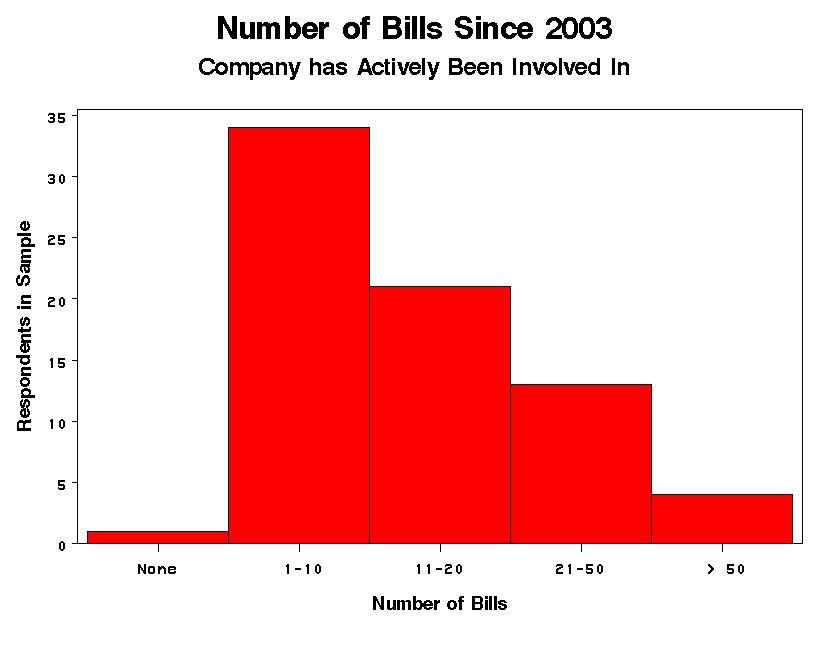
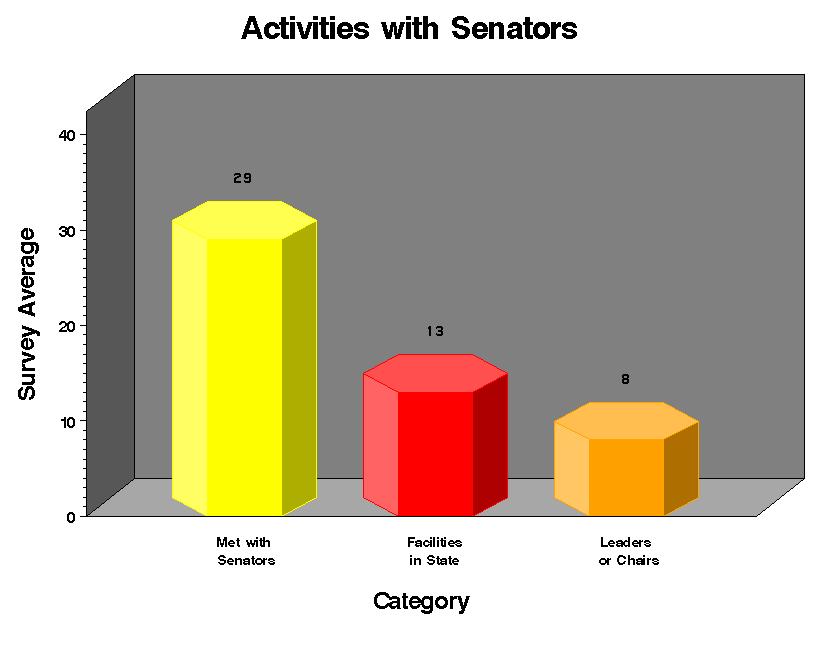
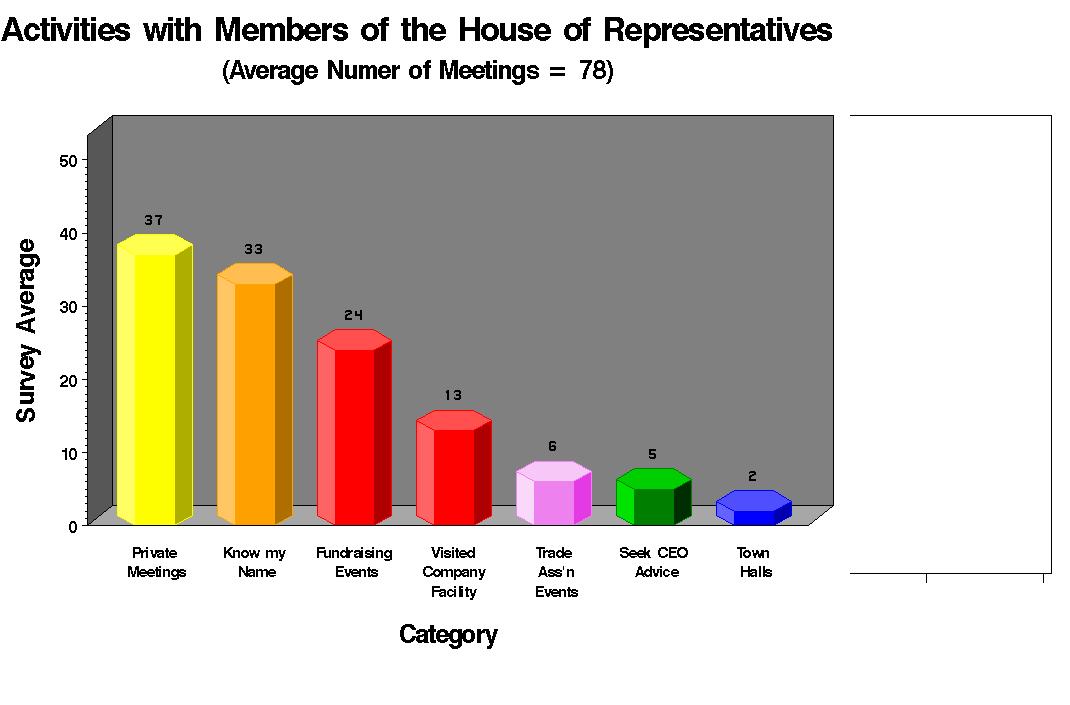
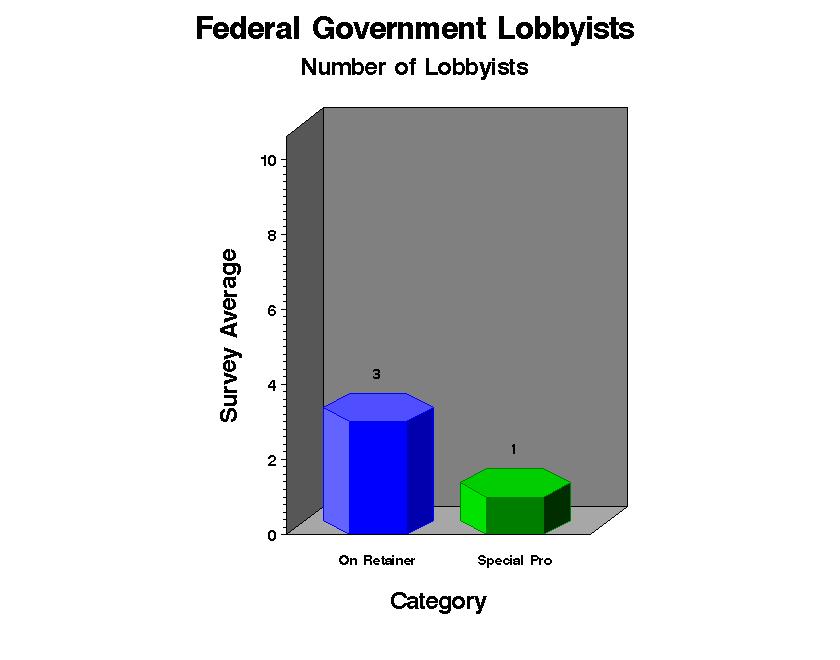
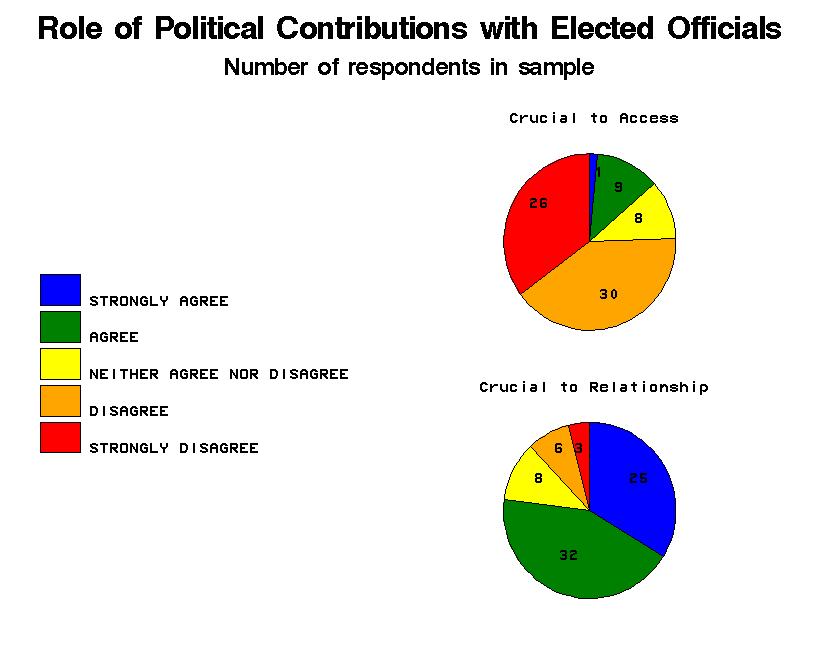
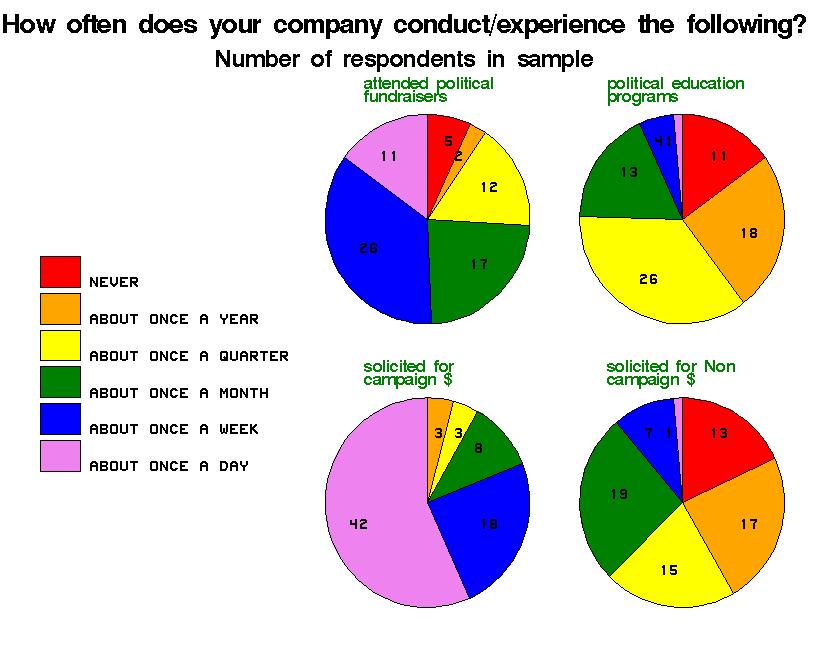
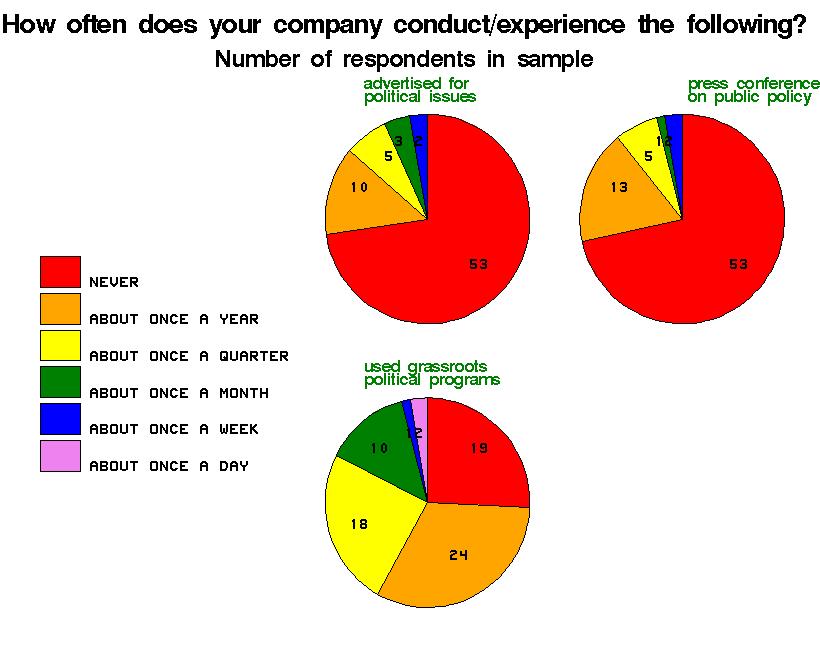
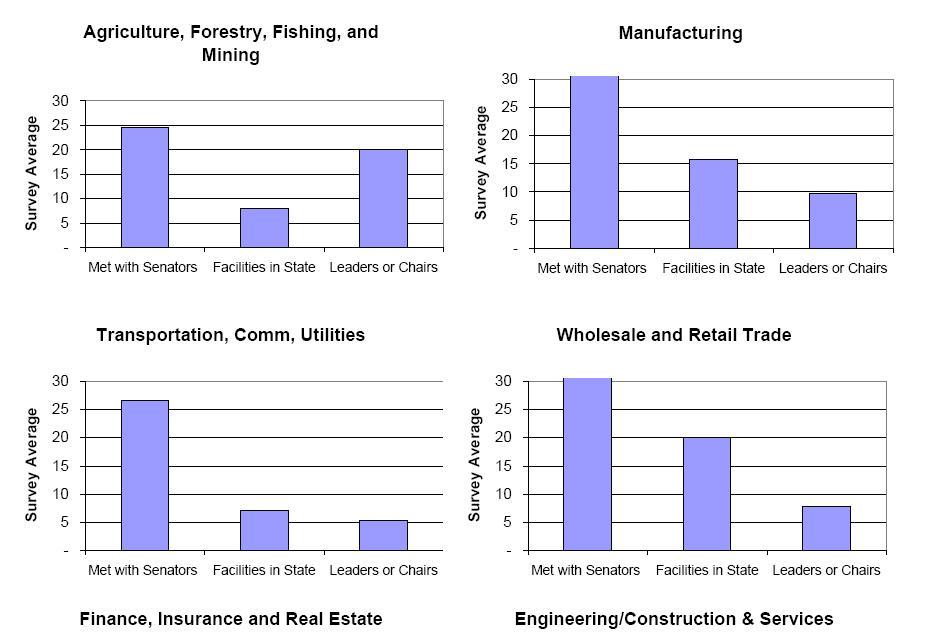
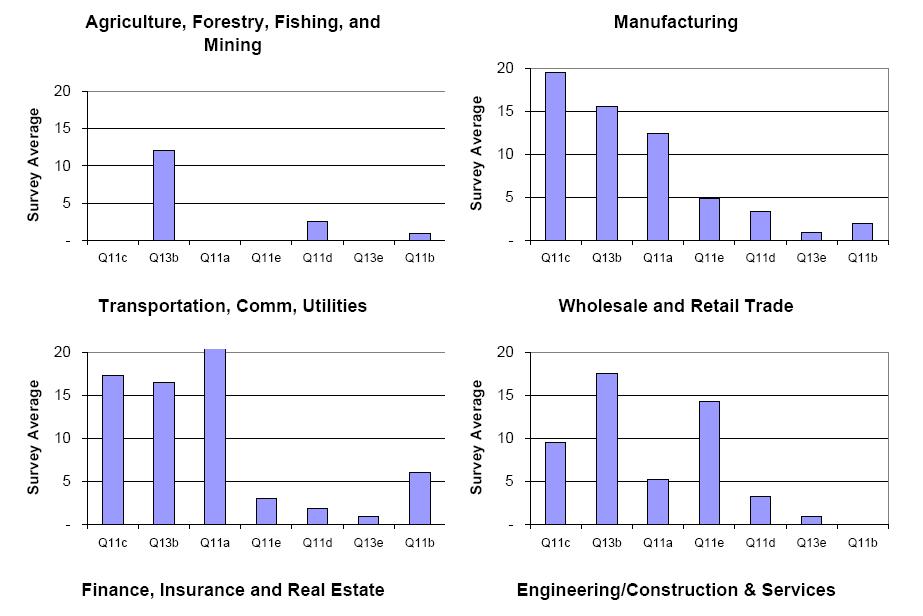
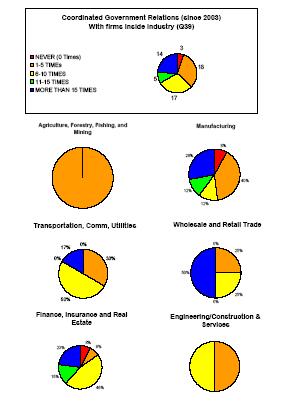
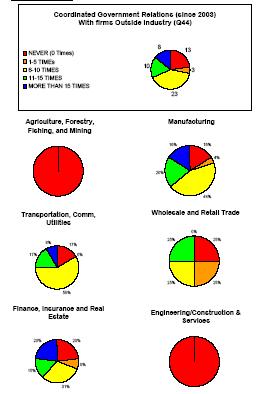
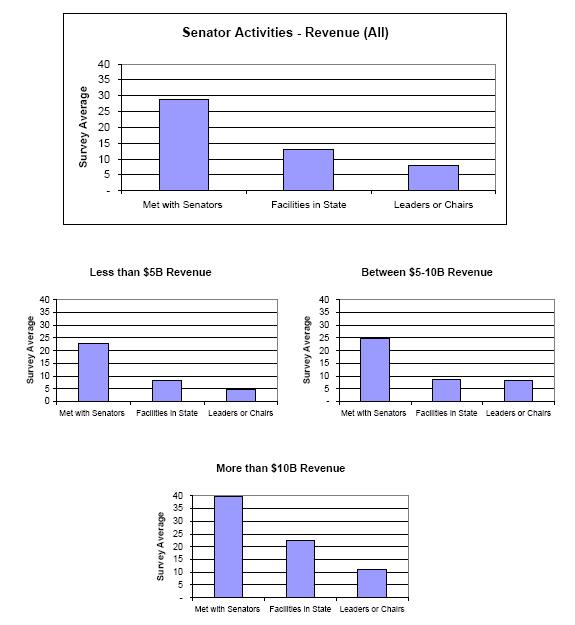
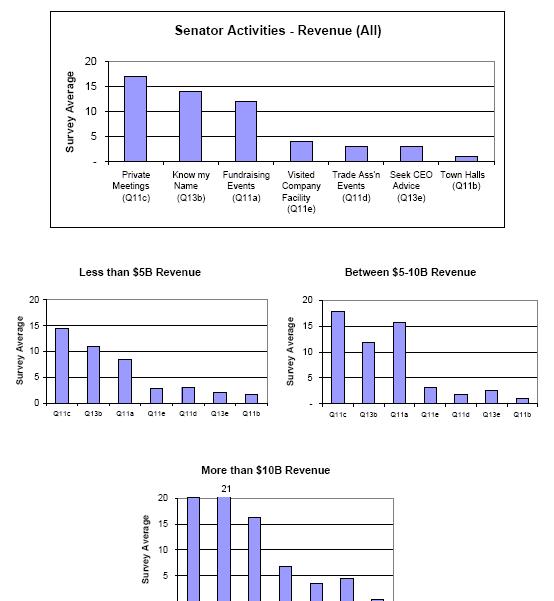
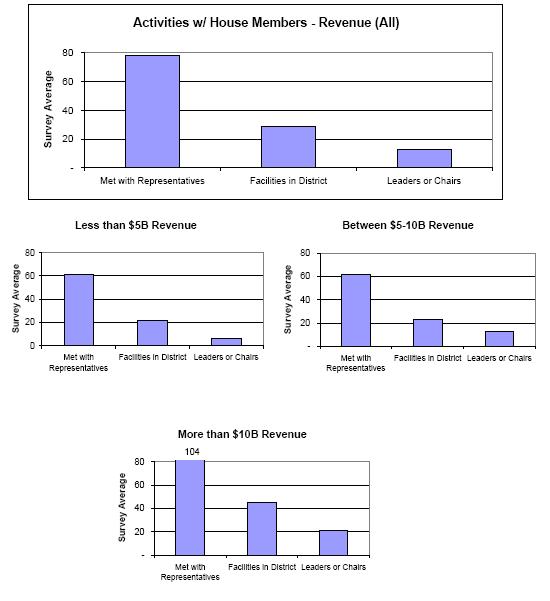
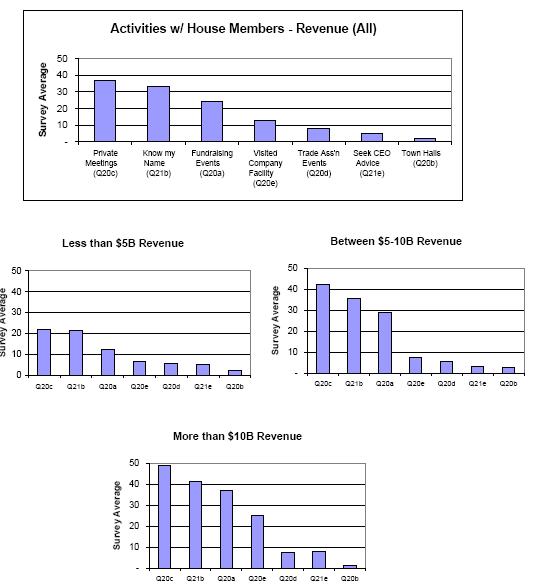
Intimacy Measures ToP
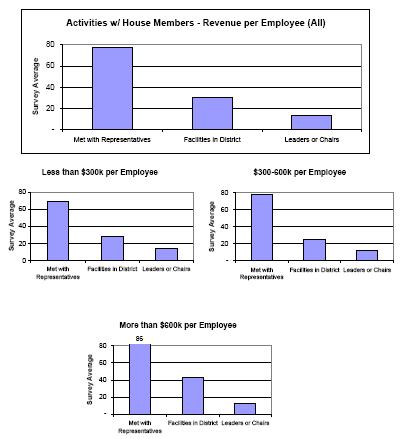
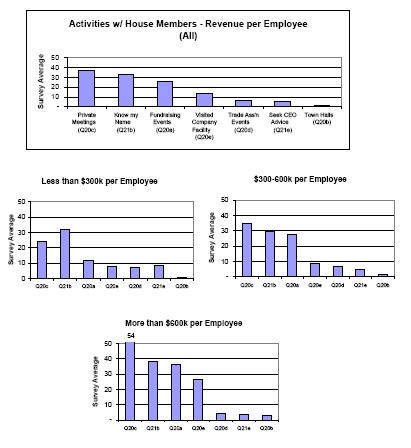
These include the 3 intimacy measures for the Senate and the House...
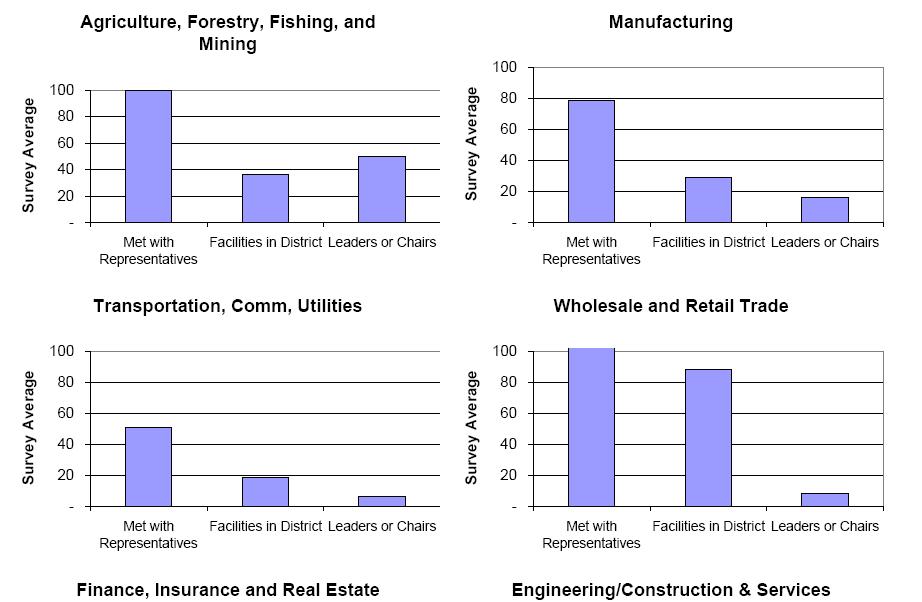
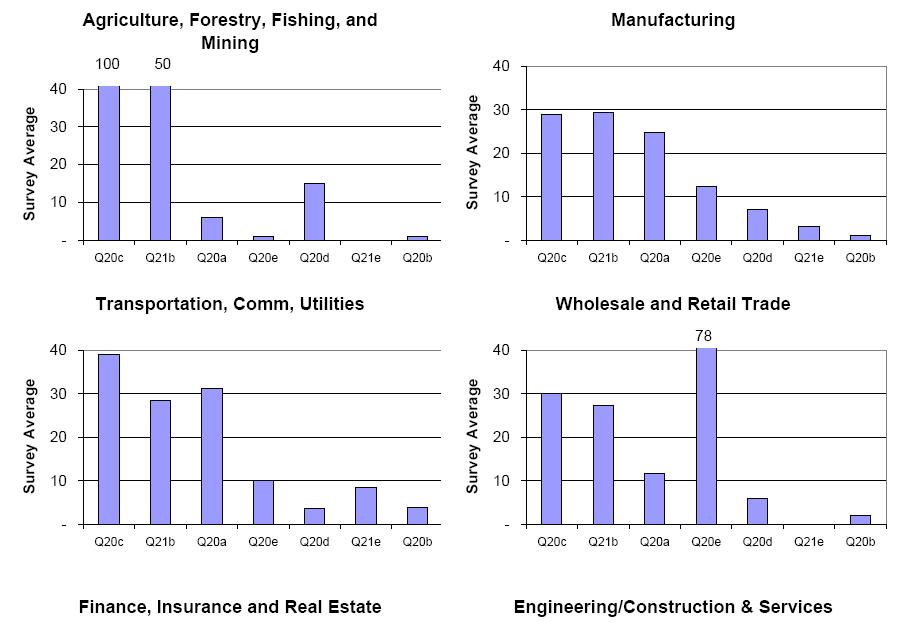
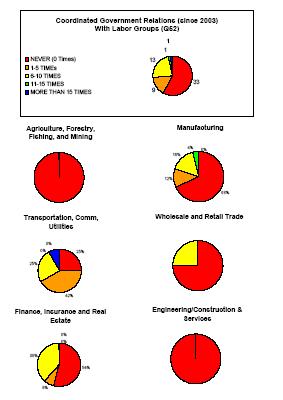
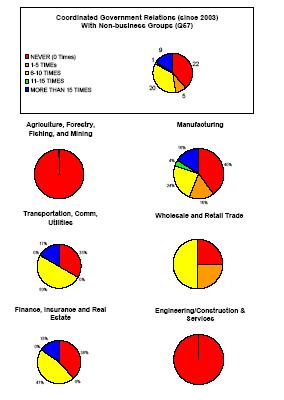
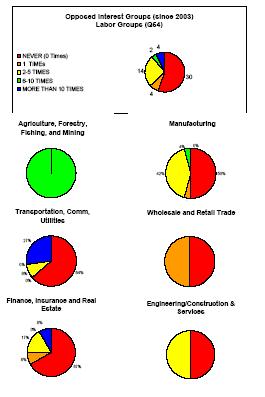
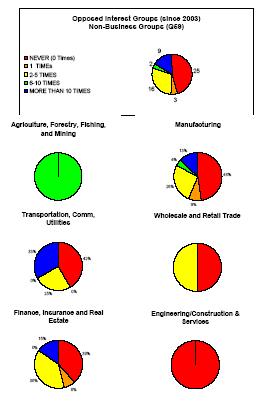
by SIC (major group) ToP
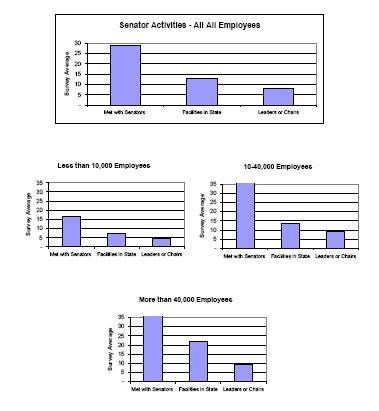
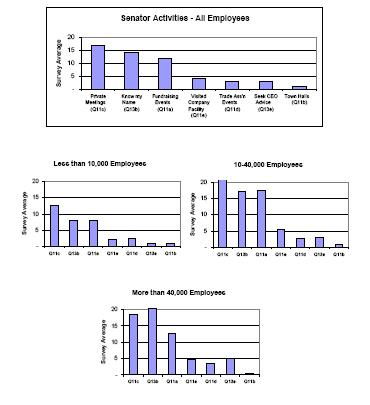
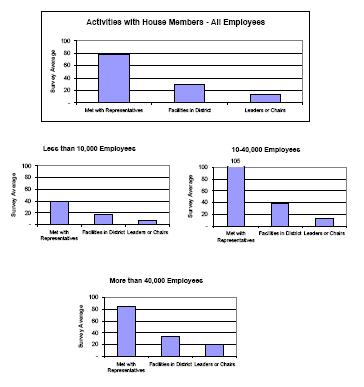
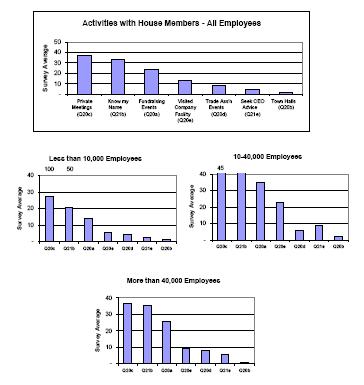
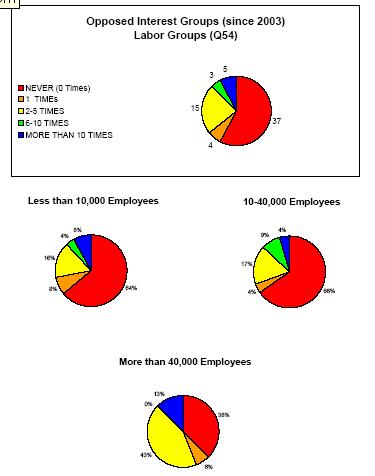
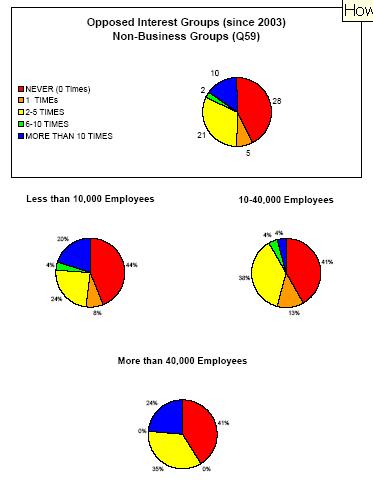
By Number of Employees ToP
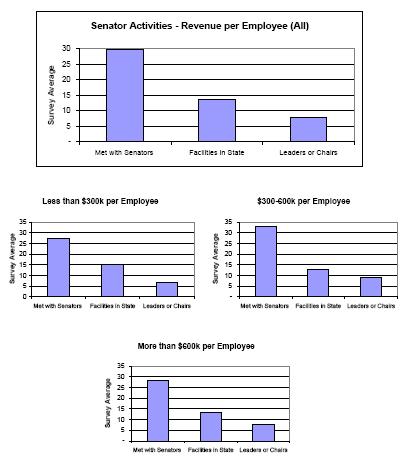
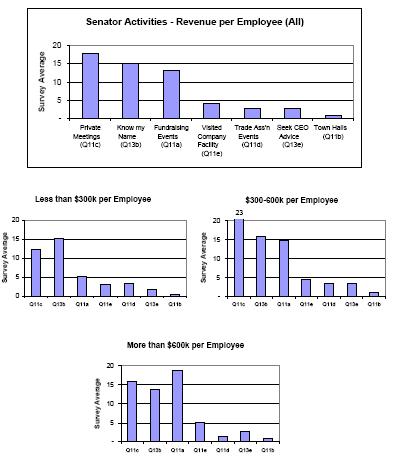
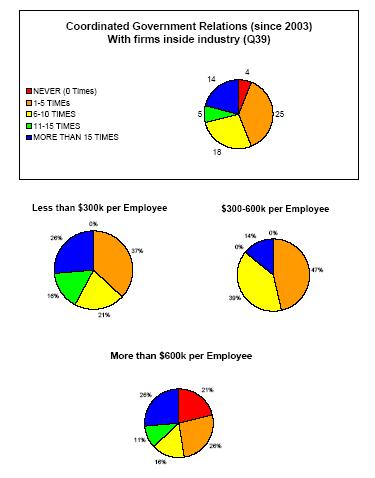
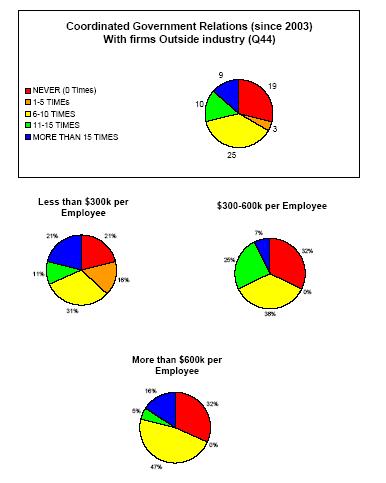
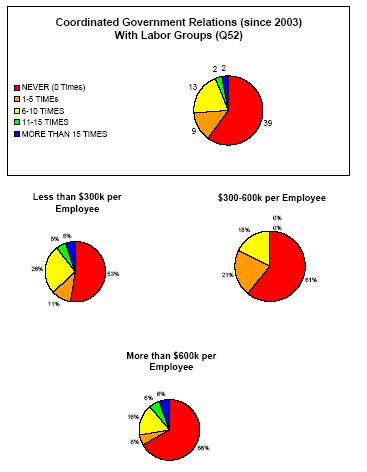
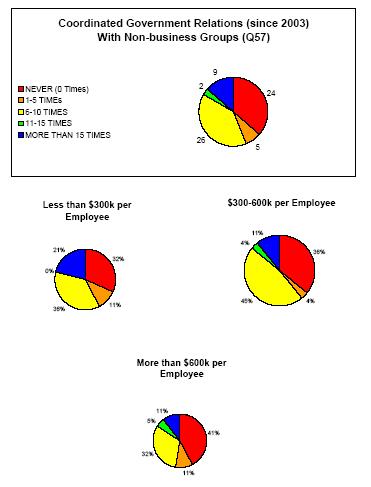
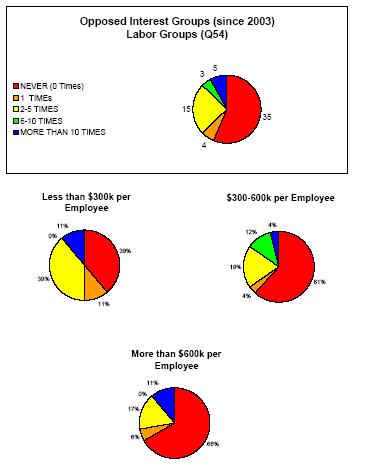
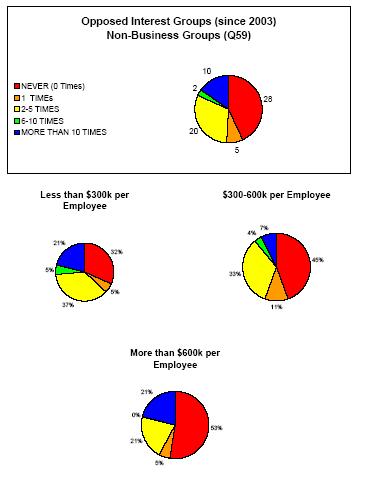
By 2003 Revenue per Employee ($000) - A productivity measure
ToP
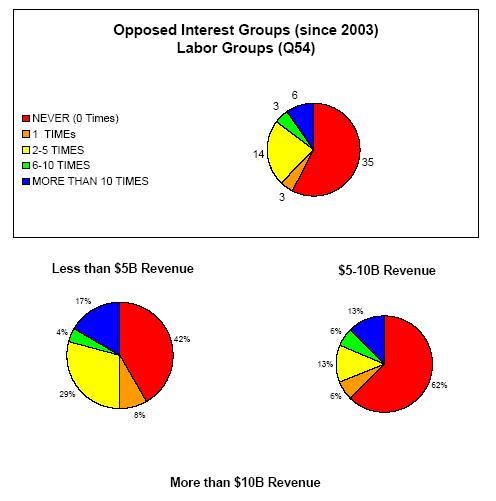
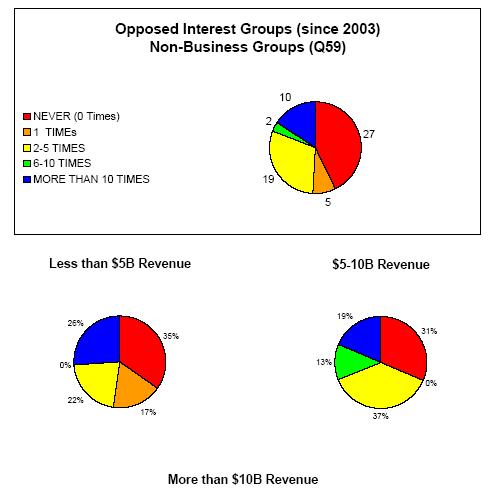
By 2003 Revenue ($M) ToP
If additional information is needed, please contact me at dobelman@stat.rice.edu