These are the alternate presentation approaches requested by the sponsor. The ones on available from the link on the left is the consolidated data; those on the right are the High Performers. The old ones (House of Pies) are available HERE.
Political Networks of Companies - New Tasking
| Consolidated data |
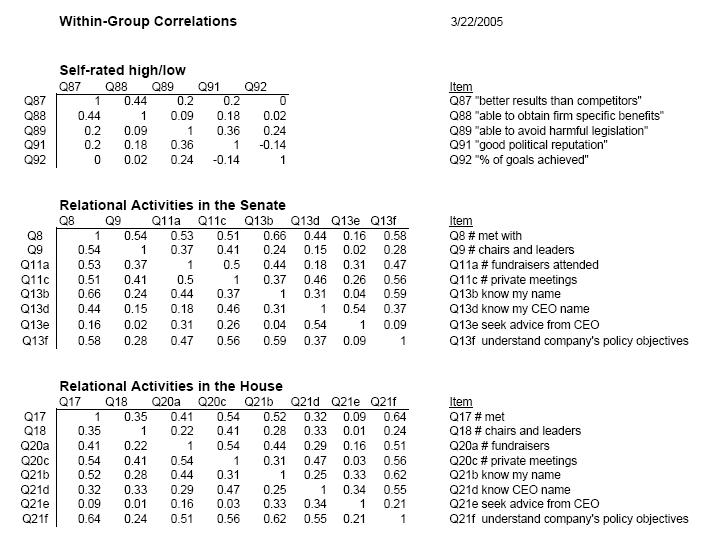
Self-rank Correlations |
Rest of Work |
by 2003 Revenue |
By SIC |
FPA Submission |
Old Data |
|
These are the alternate presentation approaches requested by the sponsor. The ones on available from the link on the left is the consolidated data; those on the right are the High Performers. The old ones (House of Pies) are available HERE. |
|
These are the LATEST SAS graphs (gif's) for all data. They are slightly different from the "NEW" data of March 2005, and slightly more different than the "old" data prior to that. (see FPA submission)
Summary Statistics for Explanatory and Congressional Activities . This version deletes the range in favor of MINIMUM and MAXIMUM. These are the consolidated data for all companies in tabular format. They have been grouped by SIC and Sales (see above menu).
Summary Statistics for Explanatory and Congressional Activities, Comparison with All and the "High-Performers." . Summary statistics for the High performers, grouped by SIC and Sales.
Summary Statistics, using RANGE. These are the consolidated data for all companies in tabular format. They have not been grouped yet by SIC or Sales, and are considered SUPERCEEDED.
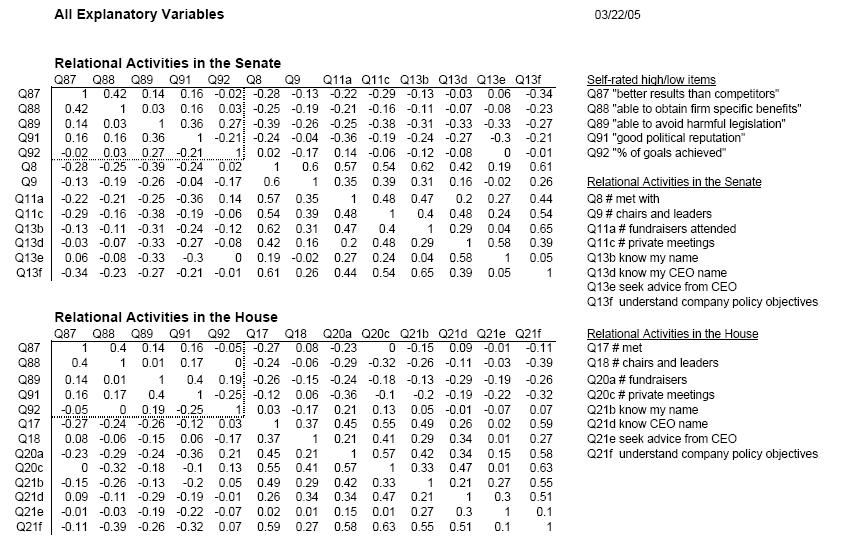
Numerical correlations of Senate and House activities with various predictor groups such as outcomes, tactics, and cooperation. These include what was previously refered to as "intimacy" measure. Due to different combinations of missing data when analyzing blocks of variables, the correlations will vary between tables.
 |
 |
The High-performers were determined to be those firms providing a mean response greater than 2.0 for questions
Q87 better results than competitors
Q88 able to obtain firm specific benefits
Q92 % of goals achieved
This sample set was of size 14. We compare this group with all respondents, also broken down as above. Due to different combinations of missing data when analyzing blocks of variables, the correlations will vary between tables.
|
|
These are the summary statistics in lieu of 3-D bar or pie charts broken down by 2003 REVENUE. Recall our breakdown:
Less than $5B revenue in 2003;
Between 5 and 10 $B revenue in 2003; and
More than $10B revenue in 2003.
This version deletes the standard deviation and the range. The range can be inferred from the MINIMUM and MAXIMUM, and the standard deviation can be inferred from the confridence interval. ..
These are the summary statistics in lieu of 3-D bar or pie charts broken down by MAJOR SIC GROUPING. Recall our breakdown:
Agriculture, Forestry, Fishing, and Mining 01-14
Manufacturing 20-39
Transportation, Communications, Electric, Gas, And Sanitary Services 40-49
Wholesale and Retail Trade 50-59
Finance, Insurance and Real Estate 60-67
Engineering, Construction, Legal, Health and Other Services 15-17, 70-89
Public Administration 91-99
This version deletes the standard deviation and the range. The range can be inferred from the MINIMUM and MAXIMUM, and the standard deviation can be inferred from the confridence interval. ..
Data and Graphics as submitted to FPA ToP
If additional information is needed, please contact me at dobelman@stat.rice.edu