


Next: About this document ...
Figure 1:
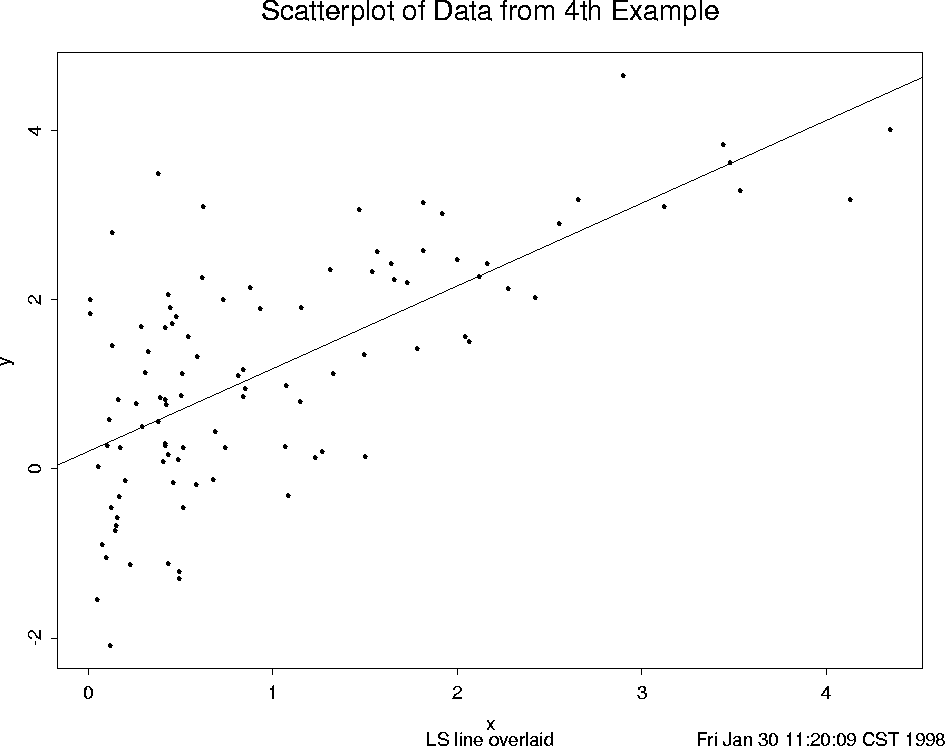
Sixth Figure in Lecture 9.
When the least squares line is drawn in, the nonlinear
association isn't so obvious. Again, the high concentration
of data points for small values of x leads to misleading
plots.
 |
Dennis Cox
2/1/1998