


Next: About this document ...
Figure 1:
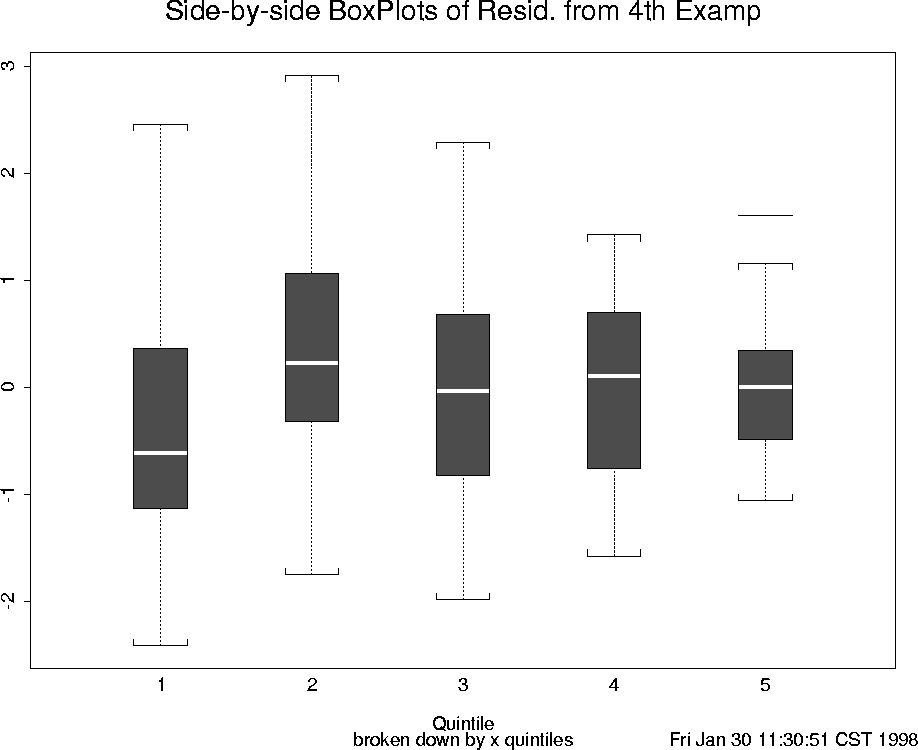
Seventh Figure in Lecture 9.
This gives side-by-side boxplots of the residuals from the
Fourth Figure, where the residuals are broken down by quintile
(fifths) of the x values. There are 100 cases in this
data set, so each quintile represents 20 values.
Thus, if the x values are arranged
in ascending order, the residuals corresponding to the smallest
are used to construct the box on the left, from the twenty-first
through forteith to construct the second one, and so forth and
the last box on the right is constructed from the residuals
corresponding to the 20 largest x values. Note that except
for the last box, the IQR's for each of the boxes is about the
same, indicating that the horn shape seen in the Fourth figure
is not really so clear as it looks.
 |
Dennis Cox
2/1/1998