![]()
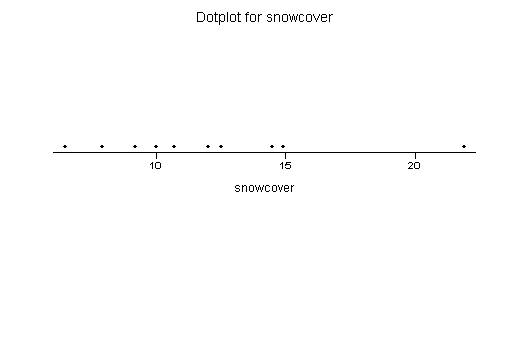
Solution: In minitab, I did a dotplot (see description in the book; a sample of size 10 is too small for a histogram). The plot was saved as a *.jpg file (from the File menu, I selected ``Save Plot as ...''). This is shown below.
The descriptive statistics were computed in minitab (Stat menu
![]() Basic Statistics
Basic Statistics ![]() Display Descriptive
Statistics) and are given below (I used the ``Save Session Window
as ...'' selection from the file menu):
Display Descriptive
Statistics) and are given below (I used the ``Save Session Window
as ...'' selection from the file menu):
Worksheet size: 5000 cells
Macro is running ... please wait

Descriptive Statistics


Variable             N       Mean     Median     TrMean      StDev    SE Mean
snowcove            10      12.01      11.35      11.46       4.39       1.39

Variable       Minimum    Maximum         Q1         Q3
snowcove          6.50      21.90       8.88      14.60
Because of the outlier, I would say the Median of 11.35 or Trimmed Mean of 11.46 (which are almost the same) would be a better representative value than the mean of 12.01. My preference is the Median as it is more widely used and easier to explain.