Solution: Of course, we can do it for a lot more lags
than 2. I made a matlab function to do an Splus style plot of the ACF.
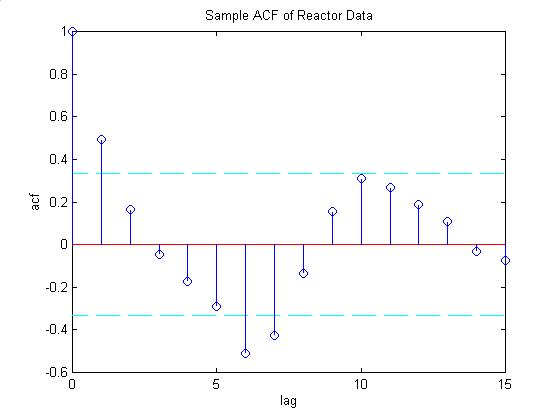
You can download the function here. A jpeg
of the plot may be viewed here. The computed
values at lags 1 and 2 are .4910 and .1639, respectively.