(1) In a sample of sixty four patients admitted to a hospital for pneumonia, the average stay was 8.4 days and the sample standard deviation was 7.2 days.
(a) Derive a 95% confidence interval for the mean hospital stay for such patients without assuming any distribution for the length of stay.
(b)
Suppose you are told that the hospital stay has approximately an
exponential distribution. How would you change your answer in
part (a). Recall that for an exponential distribution, ![]() .
.
Solution to Exercise 1.
(The solution is an MS Word document. You may have to right click
and choose "Save Target As ..." or something like that.)
(2) An ornithologist observes grackles' attempts at mating. In 75 such attempts, 21 are successful.
(a) What is your point estimate of the proportion of mating attempts which are successful?
(b) What is the estimated standard error of that estimate?
(c) Construct a 90% confidence interval for the true proportion of mating attempts which are successful.
(d) It has been claimed in the literature that fewer than 40% of the mating attempts are successful. Do these data offer strong evidence for that claim?
Solution to Exercise 2.
(The solution is an MS Word document. You may have to right click
and choose "Save Target As ..." or something like that.)
(3) Define the following hypothesis testing concepts:
Solution to Exercise 3.
(The solution is an MS Word document. You may have to right click
and choose "Save Target As ..." or something like that.)
(4) To estimate the weight gain in chickens from a supplement, the chickens are weighed before hand, put on the supplement regimen for two weeks and then weighed again. The data are entered into minitab, and two analyses are performed. First the data set:
before	after
2.23	2.67
1.76	1.90
1.84	2.15
2.08	2.01
1.96	2.40
Now the analyses:
Two Sample T-Test and Confidence Interval

Two sample T for after vs before

        N      Mean     StDev   SE Mean
after   5     2.226     0.311      0.14
before  5     1.974     0.188     0.084

95% CI for mu after - mu before: ( -0.15,  0.649)
T-Test mu after = mu before (vs >): T = 1.55  P = 0.086  DF = 6


Paired T-Test and Confidence Interval

Paired T for after - before

                  N      Mean     StDev   SE Mean
after             5     2.226     0.311     0.139
before            5     1.974     0.188     0.084
Difference        5    0.2520    0.2181    0.0975

95% CI for mean difference: (-0.0188, 0.5228)
T-Test of mean difference = 0 (vs > 0): T-Value = 2.58  P-Value = 0.031
(a) Which of these analyses is correct? Explain.
(b) What is a 95% confidence interval for the mean weight gain under this supplement regimen?
(c) Is the observed average weight gain significantly greater than 0?
Solution to Exercise 4.
(The solution is an MS Word document. You may have to right click
and choose "Save Target As ..." or something like that.)
(5) In a study of the effectiveness of an antidepressant drug, 800 subjects are randomly split into two groups of 400 each. The treatment group is given the drug and the control group is given a placebo. The number of subjects who show improvement in the treatment group is 205 and the number in the control group is 168. The researchers wish to know if these data show that the drug is statistically significantly better than the placebo. State the relevant null and alternative hypotheses, compute the P-value, and determine if the drug is significantly better than the placebo.
Solution to Exercise 5.
(The solution is an MS Word document. You may have to right click
and choose "Save Target As ..." or something like that.)
(6) In this exercise we investigate the minitab data set "tumours.mtw" which is apparently the measurements of tumour size vs. time (in days? ... weeks?) for some experimental animal. We also considered the natural logarithm and square root of the tumour size. The data are:
Time	Size	logsize	sqrtsize
14	1.25	0.22314	1.11803
16	1.90	0.64185	1.37840
19	4.75	1.55814	2.17945
21	5.45	1.69562	2.33452
23	7.53	2.01890	2.74408
26	14.50	2.67415	3.80789
28	16.70	2.81541	4.08656
30	21.00	3.04452	4.58258
33	27.10	3.29953	5.20577
35	30.30	3.41115	5.50454
37	40.50	3.70130	6.36396
41	51.40	3.93964	7.16938
The results of regression analysis considering each of the response variables. We also computed predicted values at Time = 50.
Regression Analysis

The regression equation is
Size = - 30.3 + 1.81 Time

Predictor        Coef       StDev          T        P
Constant      -30.319       4.192      -7.23    0.000
Time           1.8149      0.1489      12.19    0.000

S = 4.246       R-Sq = 93.7%     R-Sq(adj) = 93.1%

Analysis of Variance

Source            DF          SS          MS         F        P
Regression         1      2677.6      2677.6    148.52    0.000
Residual Error    10       180.3        18.0
Total             11      2857.9

Unusual Observations
Obs       Time       Size         Fit   StDev Fit    Residual    St Resid
 12       41.0      51.40       44.09        2.43        7.31        2.10R

R denotes an observation with a large standardized residual

Predicted Values

     Fit  StDev Fit         95.0% CI             95.0% PI
   60.43       3.65   (   52.29,   68.56)  (   47.95,   72.90) X
X  denotes a row with X values away from the center
The plots produced as part of the above analysis:
scatterplot,
residuals vs. fitted values,
and Normal probability plot of the residuals.
=================================================================
Regression Analysis

The regression equation is
logsize = - 1.23 + 0.136 Time

Predictor        Coef       StDev          T        P
Constant      -1.2326      0.2750      -4.48    0.001
Time         0.135650    0.009770      13.88    0.000

S = 0.2786      R-Sq = 95.1%     R-Sq(adj) = 94.6%

Analysis of Variance

Source            DF          SS          MS         F        P
Regression         1      14.958      14.958    192.78    0.000
Residual Error    10       0.776       0.078
Total             11      15.734


Predicted Values

     Fit  StDev Fit         95.0% CI             95.0% PI
  5.5499     0.2394   (  5.0164,  6.0833)  (  4.7314,  6.3683) X
X  denotes a row with X values away from the center
The plots produced as part of the above analysis:
scatterplot,
residuals vs. fitted values,
and Normal probability plot of the residuals.
=================================================================
Regression Analysis

The regression equation is
sqrtsize = - 2.25 + 0.228 Time

Predictor        Coef       StDev          T        P
Constant      -2.2548      0.1572     -14.34    0.000
Time         0.227656    0.005586      40.75    0.000

S = 0.1593      R-Sq = 99.4%     R-Sq(adj) = 99.3%

Analysis of Variance

Source            DF          SS          MS         F        P
Regression         1      42.131      42.131   1660.77    0.000
Residual Error    10       0.254       0.025
Total             11      42.385


Predicted Values

     Fit  StDev Fit         95.0% CI             95.0% PI
  9.1280     0.1369   (  8.8229,  9.4330)  (  8.6600,  9.5960) X
X  denotes a row with X values away from the center
The plots produced as part of the above analysis:
scatterplot,
residuals vs. fitted values,
and Normal probability plot of the residuals.
(a) Which regression fit do you think is best? Justify your answer.
(b) Based on the best regression model in (a), give your best prediction of the tumour size at Time = 50 with a 95% prediction interval. Don't forget to convert back to the original units if you use one of the transformed responses logsize or sqrtsize.
Solution to Exercise 6. (The solution is an MS Word document. You may have to right click and choose "Save Target As ..." or something like that.)
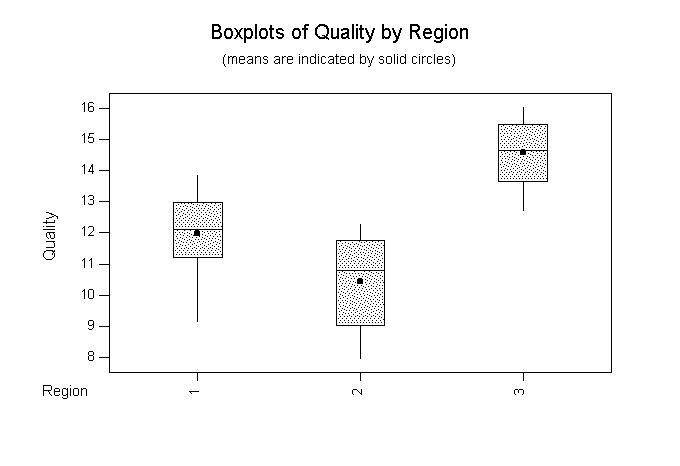
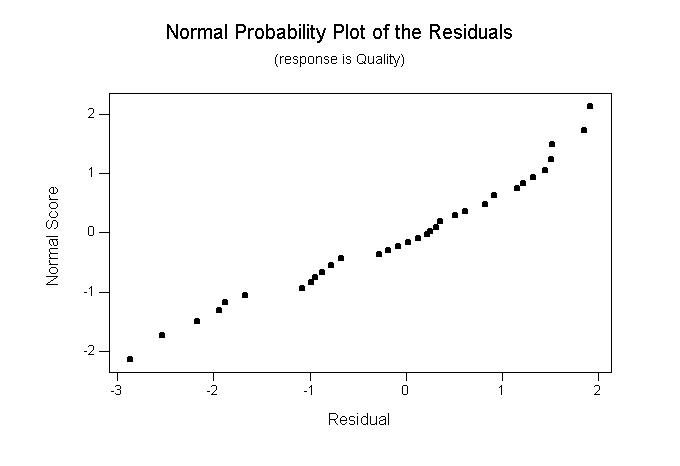
(7) The minitab data set "winde.mtw" has quality ratings of a number of wines from three different regions of France. Is there a significant difference in the mean quality rating among the regions? The minitab analysis follows. Plots appear here and here. Describe the results of this analysis as completely as possible. Discuss the assumptions behind the analysis and whether or not there is any evidence concerning the validity of the assumptions.
One-way Analysis of Variance Analysis of Variance for Quality Source DF SS MS F P Region 2 94.62 47.31 27.52 0.000 Error 35 60.17 1.72 Total 37 154.79 Individual 95% CIs For Mean Based on Pooled StDev Level N Mean StDev -+---------+---------+---------+----- 1 17 11.976 1.328 (---*---) 2 9 10.444 1.515 (----*-----) 3 12 14.583 1.112 (----*----) -+---------+---------+---------+----- Pooled StDev = 1.311 9.6 11.2 12.8 14.4 Tukey's pairwise comparisons Family error rate = 0.0500 Individual error rate = 0.0196 Critical value = 3.46 Intervals for (column level mean) - (row level mean) 1 2 2 0.210 2.854 3 -3.816 -5.553 -1.397 -2.724
Solution to Exercise 7. (The solution is an MS Word document. You may have to right click and choose "Save Target As ..." or something like that.)
(8) Exercise 14.07, p. 624.
Solution to Exercise 8. (The solution is an MS Word document. You may have to right click and choose "Save Target As ..." or something like that.)