Two-way Analysis of Variance


Analysis of Variance for Yield
Source        DF        SS        MS        F        P
Formulat       1   2253.44   2253.44   376.27    0.000
Speed          2    230.81    115.41    19.27    0.000
Interaction    2     18.58      9.29     1.55    0.252
Error         12     71.87      5.99
Total         17   2574.70

                       Individual 95% CI
Formulat        Mean   --------+---------+---------+---------+---
1             187.03                                    (-*--)
2             164.66    (-*--)
                       --------+---------+---------+---------+---
                          168.00    175.00    182.00    189.00

                       Individual 95% CI
Speed           Mean   --------+---------+---------+---------+---
60             177.8                           (------*------)
70             170.8   (------*-------)
80             178.9                              (------*-------)
                       --------+---------+---------+---------+---
                           171.0     174.0     177.0     180.0
(a) The interaction was not significant (p = 0.252), so I guess the answer is, ``No, there does not appear to be an interaction ...''
(b) Bot of the main effects are significant (p = 0.000 in both cases), so the yield does appear to depend on both speed and formulation.
(c) The main effects:
| Factor | Level | Symbol | Estimate |
| Formulation | 1 | 187.03 | |
| Formulation | 2 | 164.66 | |
| Speed | 60 | 177.8 | |
| Speed | 70 | 170.8 | |
| Speed | 80 | 178.9 |
(d) I asked to store the fitted values and residuals, so they appear in the printout of the data set below:
| Yield | Speed | Formulation | RESI1 | FITS1 |
| 189.7 | 60 | 1 | 0.23333 | 189.467 |
| 188.6 | 60 | 1 | -0.86667 | 189.467 |
| 190.1 | 60 | 1 | 0.63333 | 189.467 |
| 185.1 | 70 | 1 | 4.50000 | 180.600 |
| 179.4 | 70 | 1 | -1.20000 | 180.600 |
| 177.3 | 70 | 1 | -3.30000 | 180.600 |
| 189.0 | 80 | 1 | -2.03333 | 191.033 |
| 193.0 | 80 | 1 | 1.96667 | 191.033 |
| 191.1 | 80 | 1 | 0.06667 | 191.033 |
| 165.1 | 60 | 2 | -1.10000 | 166.200 |
| 165.9 | 60 | 2 | -0.30000 | 166.200 |
| 167.6 | 60 | 2 | 1.40000 | 166.200 |
| 161.7 | 70 | 2 | 0.66667 | 161.033 |
| 159.8 | 70 | 2 | -1.23333 | 161.033 |
| 161.6 | 70 | 2 | 0.56667 | 161.033 |
| 163.3 | 80 | 2 | -3.43333 | 166.733 |
| 166.6 | 80 | 2 | -0.13333 | 166.733 |
| 170.3 | 80 | 2 | 3.56667 | 166.733 |
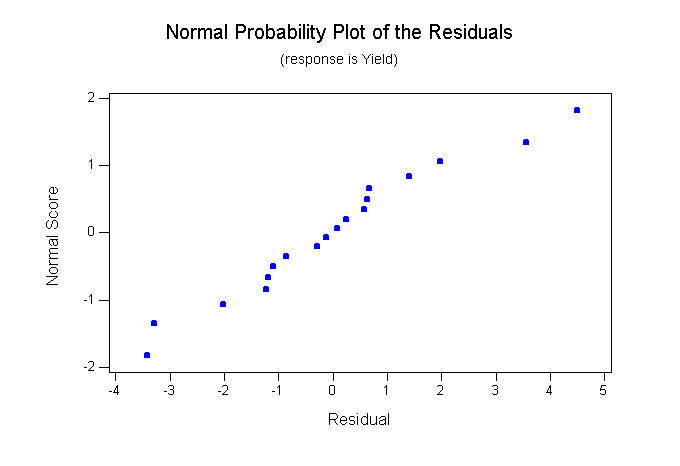
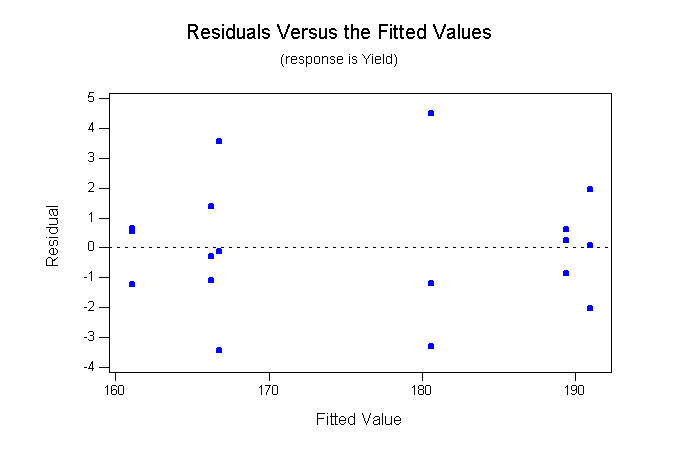
(e) The normal probability plot appears here. It looks pretty good. However, the plot of residuals vs. fitted values which appears here shows evidence that there is not a constant variance.