Political Networks of Companies - Graphics and Data AS SUBMITTED to FPA
| Consolidated data |
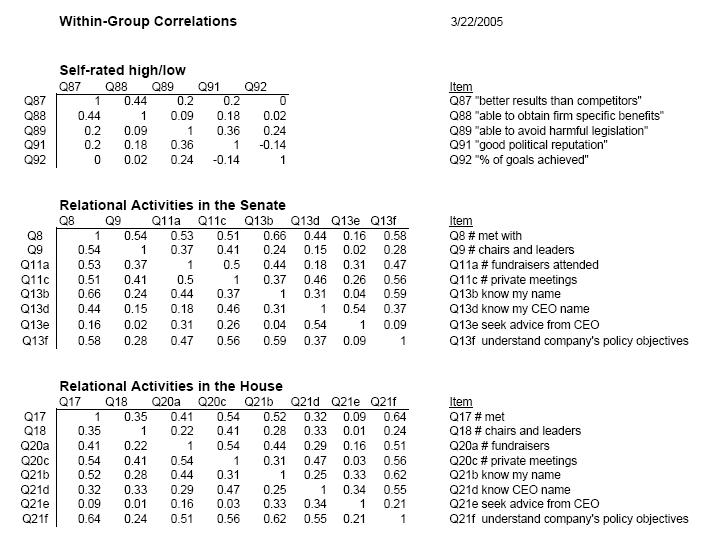
Self-rank Correlations |
Intimacy |
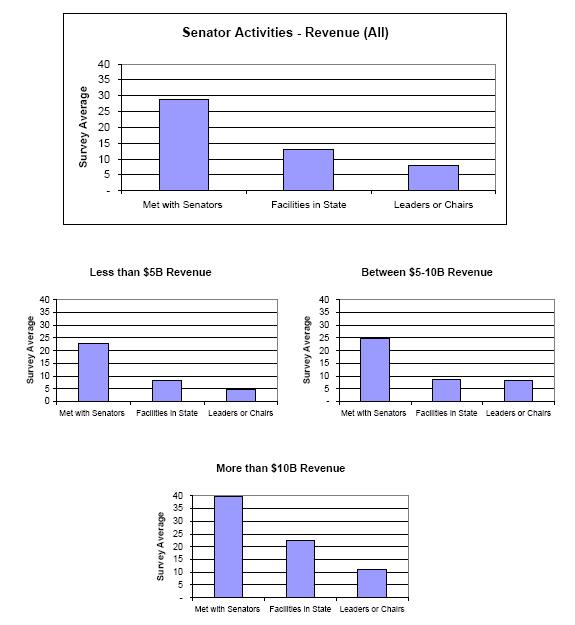
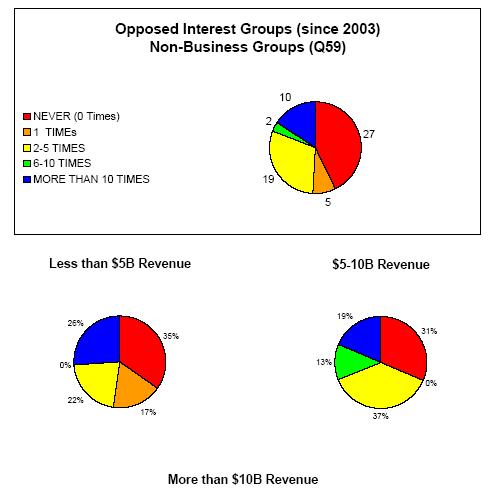
by 2003 Revenue |
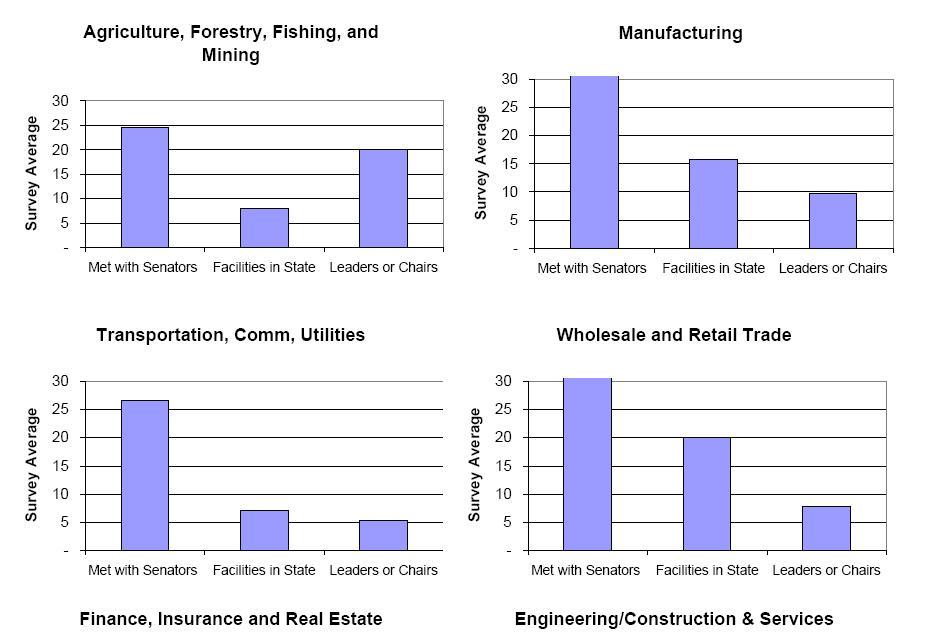
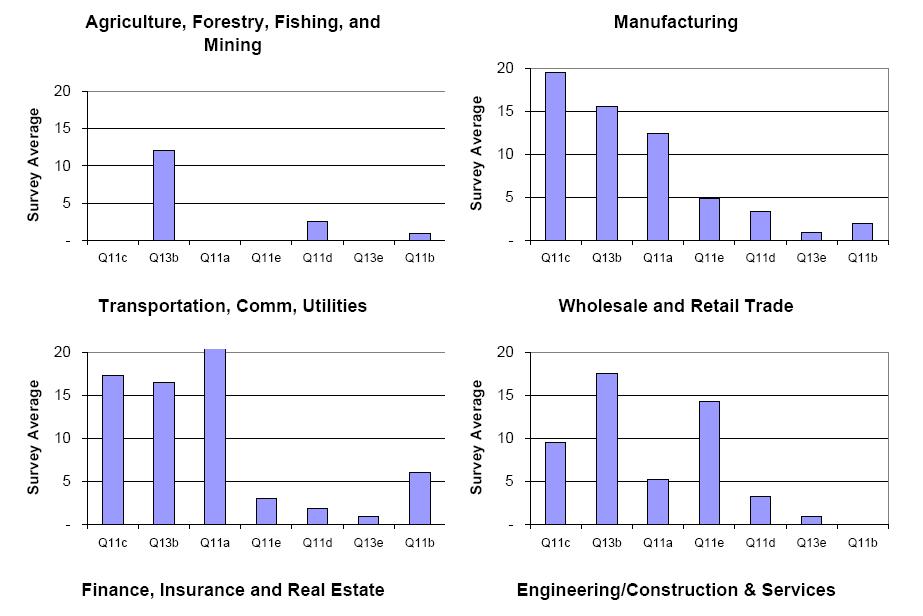
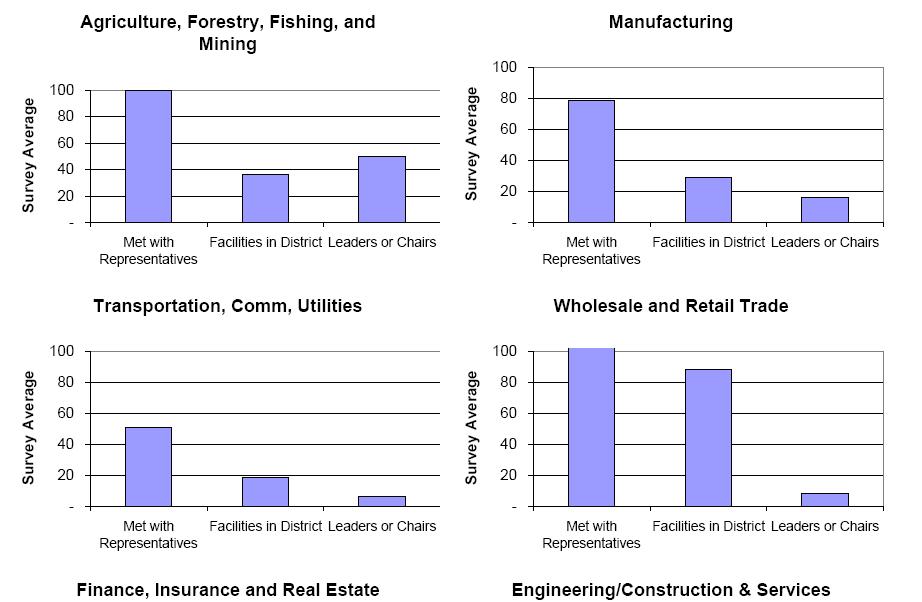
By SIC |
tbd 2 |
Old Data |
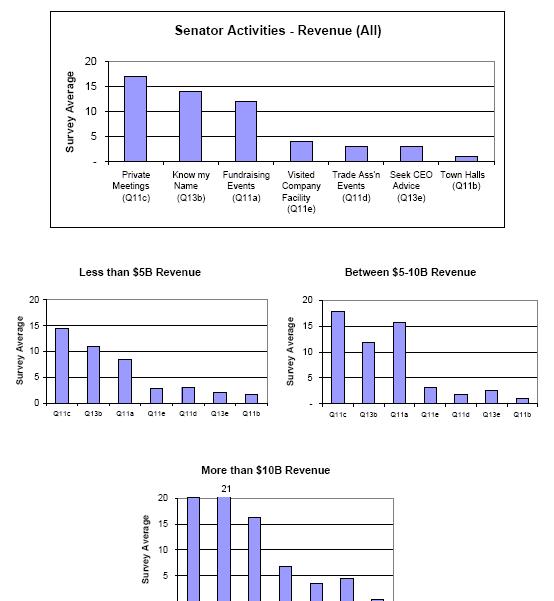
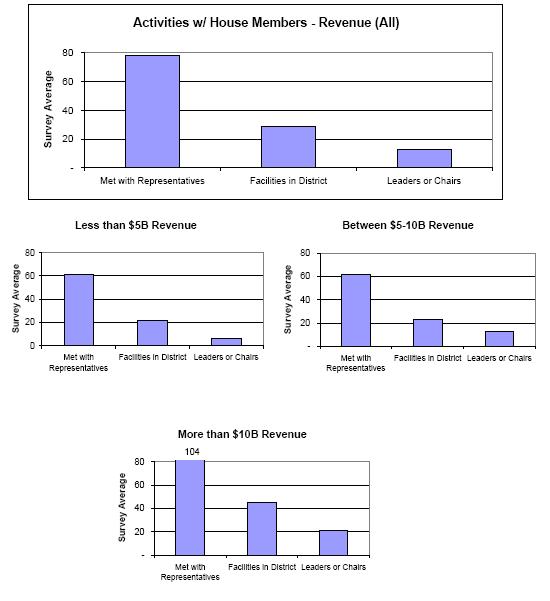
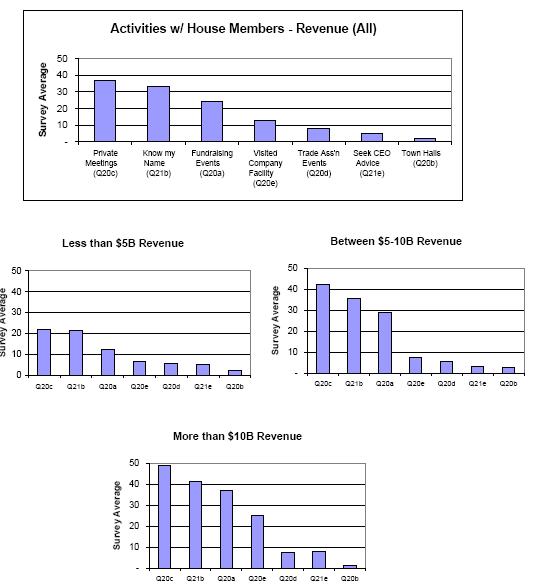
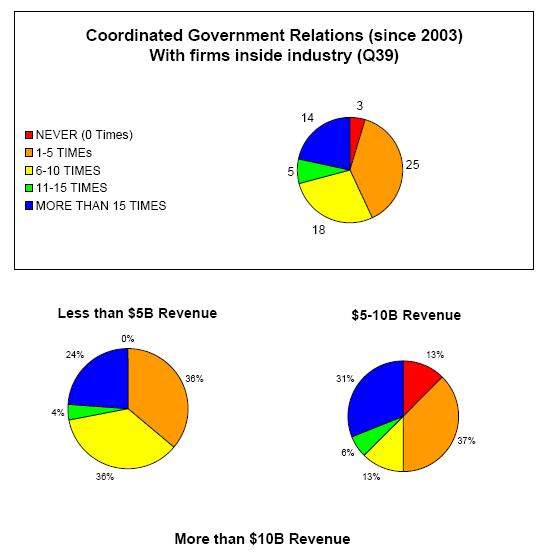
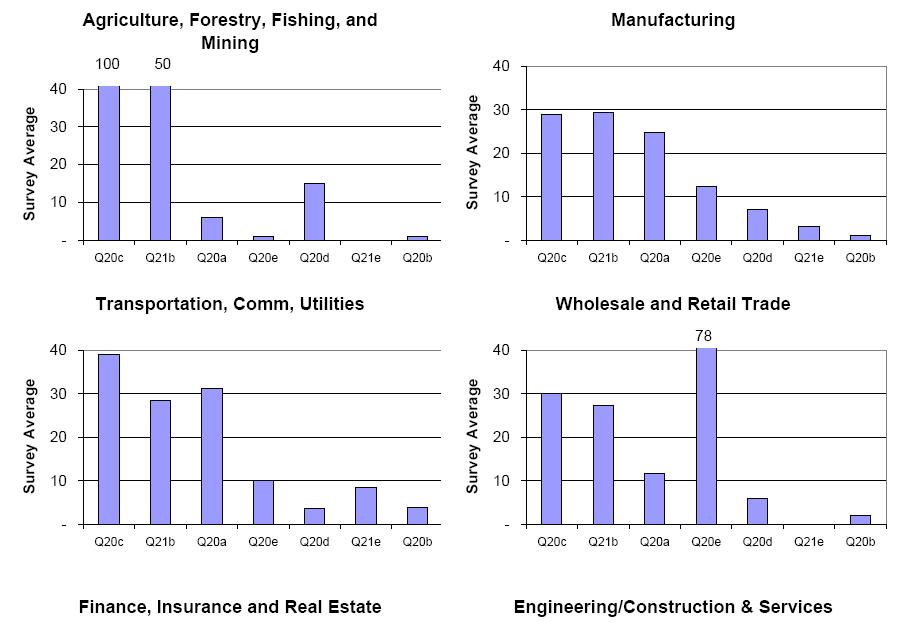
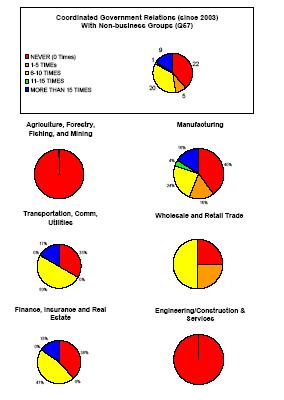
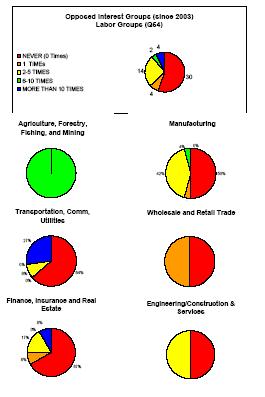
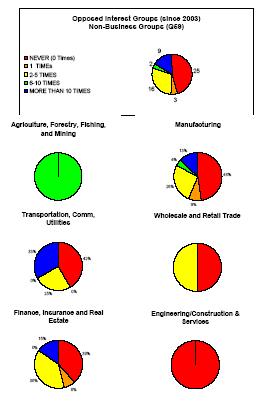
These are the NEW SAS graphs (gif's) for all data. They are all slightly different from the "old" data.
|
|
|
|
|
|
|
|
|
|
|
|
|
|
|
|
|
|
|
Numerical correlations of Senate and House activities with the self-ranked high/low Predictors. These include the intimacy variables now, too. NOTE: Due to data entry inconstency, DO NOT USE previous versions of this data. Confidence intervals on these correlations need to be constructed.
 |
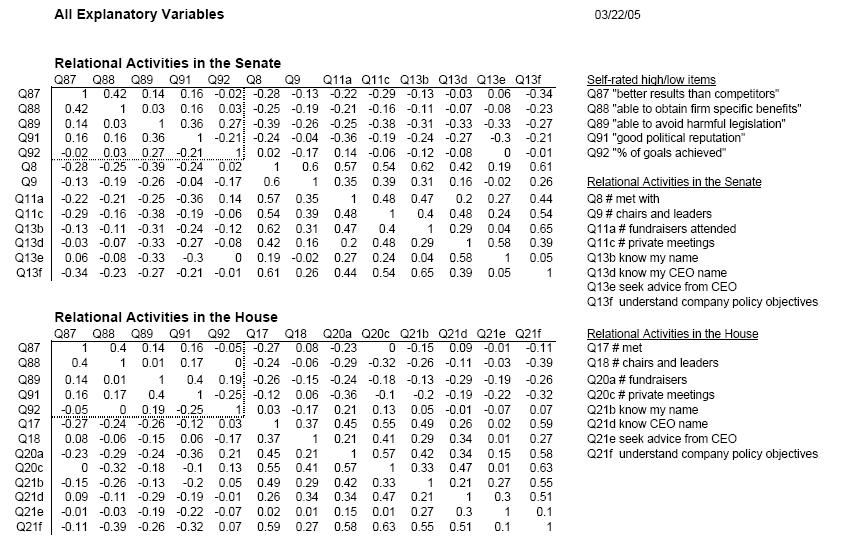 |
These include the 3 intimacy measures for the Senate and the House...
 |
 |
These have been updated for the new data.......
 |
 |
 |
 |
 |
 |
 |
 |
 |
 |
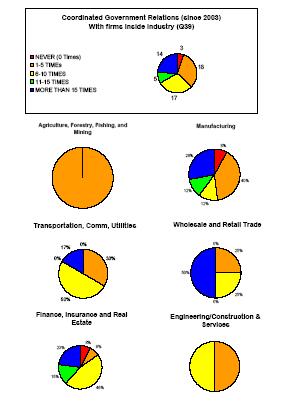
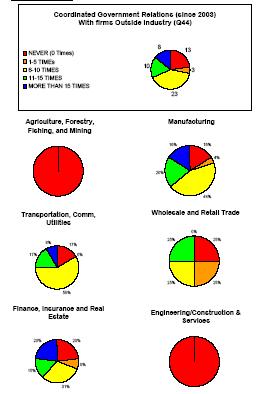
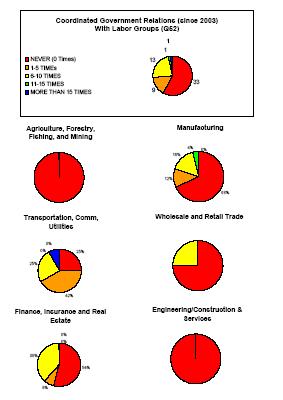
NOTE: The thumbnails are the old data, but the underlying images are the new data...
 |
 |
 |
 |
 |
 |
 |
 |
 |
 |
If additional information is needed, please contact me at dobelman@stat.rice.edu