Political Networks of Companies - AOM Conference Paper
Apparent Determinants of a Firm's Political Access
Pre-Deadline Summary of Variables of Pertinent Variables and Results
Results of Hypothesis Variable Approach .DOC version XLS results final. NOTE that the .xls version does not contain the regressions, those are only avaiable on the .doc version, but all other cumulative results are in the xls.
Here's the little figure aom.allcorrelations.ps.rotated.gif used for inserting the entire correlation table into Word.
Restated Research Questions
Be sure to REFRESH Often!
ToP
Variable Clarification for Survey Numbering Discrepancies
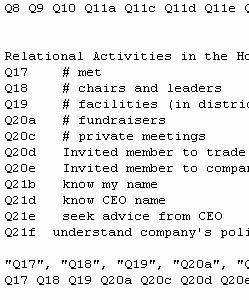 |
As previously noted, there were various versions of the surveys floating around, and so some questions numbers were based on old versions of the survey. This has been noted in correspondence between the authors and the FPA, I believe.
This restatement of research question includes the survey question numbers that correspond to the survey data, as well as decisions made on controls/financial incentive.
|
Addition of a Pecuniary Control/Incentive Variable
See Pecuniary Largess as a Variable in Corporate Political Activities. This variable actually made it into the regression for Senate network size, unlike Revenue02, which never significantly contributed to the response.
Linear Regressions
Simple Linear Regression -- HEY! We got Normal residuals on Questions 17 and 11c!
Reduced Predictors on Individual Response Variable
The source spreadsheet is available here (.XLS), or use the presentation version .
Pre-Reduced Predictors on Individual Response Variable
The source spreadsheet is available here (.XLS), or use the presentation version .
Notes on Variable Elimination
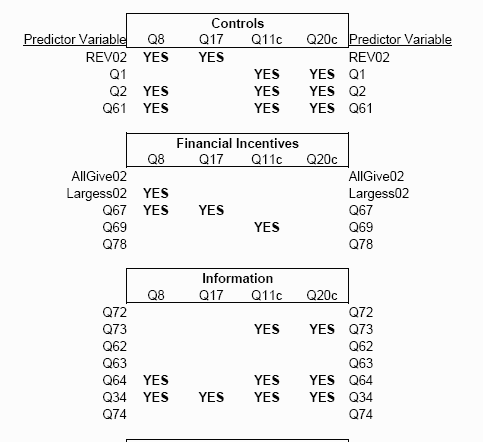 |
Variable Elimination .
This document summarizes the predictor variable elimination process. Briefly, regression vaiables selected for inclusion via forward/Efroymson and Exhaustive stepwise regression. The modified forward (Efroymonson) and exhaustive set techniques yielded the same results. Variable not noted as YES are to be excluded. The included variables from all predictors on each response sub-stantially matches those included when each class of predictor variables was considered separately.
Since the predictors had little internal colinearity, we see that exclusion is most likely the result of not contrinuting to the least squares solution. The complete list of excluded variables and discussion is on the spreadsheet and notes document below.
The source spreadsheet is available here (.XLS)
The source document is available here (.DOC)
|
Regulatory Uncertainty - Q25 and Q26 ToP
Revise analysis to consider effect of Regulatory Uncertainty as measured by Q25 and Q26.
 |
Inclusion of Q25 and Q26 makes a difference.
Here is an introductory writeup of the significant findings.
See the comparative chart showing the "Deltas" on regression coefficients/predictors as a result of including the new variables, and what dropped out, and what changed on Q11c and Q20c (Q8 and Q17 remained the same).
CAVEAT: I have not updated the Research Question Restatement to incorporate these new variables. Note that the Likert Scale [1 Agree - Disagree 5] on Q25 puts high values on LOW DEGREES of regulation. On Q26, a high value indicates a QUICKLY CHANGING regulatory environment, so interpret weights accordingly.
|
Correlation Analysis
ToP
Simple Correlations, Reduced Rank ..
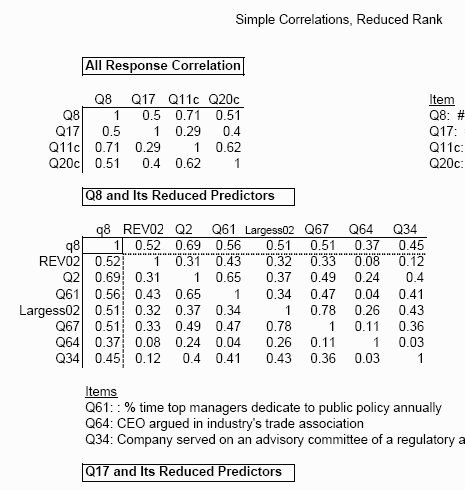 |
Simple Correlations, reduced Rank The 95% confidence interval for a typical one of these is about +/- 0.22!
The source spreadsheets are available here (.XLS)
All of the Likert response variables are ordered in least to most favorable, so we know the sign of these correlations. The coding on the YES/NO answers seem to be 1=YES, 2=NO, so these would indicated correlation of the opposite sign. The Likert scales are indicated on the restated survey questions.
|
Simple Correlations, All Predictors
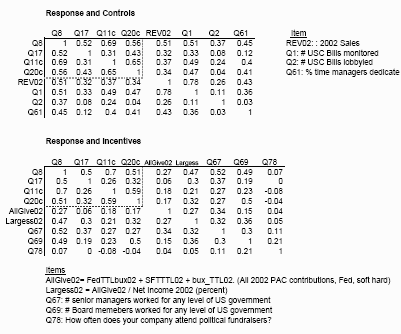 |
Simple Correlations, All Predictors The 95% confidence interval for a typical one of these is about +/- 0.22!
The source spreadsheets are available here (.XLS)
|
Documentation and Notes for Submission Paper
ToP
Notes on DATA
Notes on Regression and METHODS
Notes on CONCLUSION
Notes on NOTES
Notes on Variables (same as in "Restated Questions" section)
Other Explorations ToP
Categorical Data Analysis of SIC Code on Response Variables
coming coming coming
Company Names Distribution.
 |
Distribution of first names of respondent companies .
Here're some linguistic statistics for you. One wonders about the distribution of names of stocks. We have a smaple of names of stocks from a big institutional portfolio to compare against our 221 respondents, and also the distribution of a sample of English surnames.
Differences between the institutional portfolio and our respondents could be attributable to (a) Large cap more politically active; (b) research bias in selecting companies for survey; or (c) some characteristic of companies which chose to complete or return the survey. (a) as a factor is ruled out since institutional portfolio generally collects stocks in our respondents' capitalization range. So (b) or (c) are the more likely explanations, with (c) being a probable candidate.
|
... null ...
... null ...
Data/Graphics submitted to FPA and Intimacy Follow-on Work for Rehbein ToP
If additional information is needed, please contact me at dobelman@stat.rice.edu


